

Abstract
Abstract
We encapsulate a TetR-repressed, anhydrotetracycline (aTc)-inducible deGFP cell-free expression reaction inside giant unilamellar vesicles and test whether the sensor retains its dose-response behind a lipid bilayer. Vesicles are formed by inverted emulsion transfer from POPC:cholesterol (9:1) doped with 0.1 mol% Liss Rhod PE, using a sucrose-in/glucose-out density mismatch to drive droplets across the oil-water interface during centrifugation.
Three inner solutions are compared: a no-DNA autofluorescence floor, a 1 nM pOpen-TetO-deGFP unrepressed ceiling, and a 1 nM DNA plus 1000 nM purified His-TetR repressed sensor. Each is titrated across four aTc levels and imaged in a BSA-blocked 384-well glass-bottom plate, scoring lumen GFP only in objects with a continuous rhodamine rim. Reserved inner solution is run unencapsulated on a plate reader in parallel, so a failure of the circuit can be distinguished from a failure of encapsulation.
Overview
This protocol encapsulates a TetR-repressed, aTc-inducible deGFP transcription-translation reaction inside giant unilamellar vesicles (GUVs) and asks whether the sensor still responds to inducer once it is behind a membrane. GUVs are formed by inverted emulsion transfer, and the dose-response to anhydrotetracycline (aTc) is read by fluorescence microscopy.
The genetic circuit. The pOpen-TetO-deGFP plasmid places a tetO operator between the T7 promoter and the deGFP coding sequence. Purified His-tagged TetR (MedChemExpress) binds tetO and blocks transcription; aTc binds TetR and releases it, restoring deGFP expression. Output is therefore a graded GFP signal set by the aTc concentration.
Why GUVs. The inverted emulsion (emulsion transfer) method builds the bilayer in two steps. A water-in-oil droplet of inner solution acquires a lipid monolayer in the lipid/mineral-oil phase; centrifugation drives the droplet through a second monolayer at an oil/water interface, completing the bilayer. A sucrose/glucose density mismatch between inner and outer solutions provides the driving force and lets vesicles pellet.
What the three inner solutions test. Condition 1 (no DNA) sets the autofluorescence floor of the cell-free mix. Condition 2 (1 nM DNA, no TetR) gives the unrepressed expression ceiling. Condition 3 (1 nM DNA + 1000 nM TetR) is the repressed sensor, titrated across four aTc levels.
Readouts. Rhodamine-PE at 0.1 mol% labels the membrane, so vesicle lumen GFP can be scored only in objects with a continuous rhodamine rim. Extra inner solution is run unencapsulated on a plate reader in parallel, so bulk and encapsulated behavior can be compared directly.
A run is successful if unilamellar, rhodamine-rimmed vesicles are recovered; the unrepressed condition is clearly brighter than the no-DNA condition; and the TetR condition climbs with increasing aTc rather than sitting flat at either extreme.
Materials
Stocks to prepare in advance
Prepare these before the day of the experiment; everything after the lipid film is time-sensitive.
Table 4:Stocks to prepare before the day of the experiment.
| Stock | Concentration | Storage | Notes |
|---|---|---|---|
| Glucose | 2 M | RT | Outer solution component |
| HEPES | 1 M, pH 7.6 | 4 °C | Outer solution buffer |
| Sucrose | 400 mM | 4 °C | Inner solution osmolyte |
| BSA | 2% w/v in water | 4 °C | Glass passivation, make fresh weekly |
| aTc | 5000 uM | −20 °C, dark | Light-sensitive; wrap in foil |
| Plasmid | 100 nM in nuclease-free water | −20 °C | |
| TetR | ~10 µM | −80 °C, single-use aliquots | Avoid freeze-thaw |
Lipid films can be dried the day before and left under vacuum overnight.
Part 1 — Lipid-in-oil preparation
Target composition is 9:1 POPC:cholesterol with 0.1 mol% Rhod-PE, delivered as 4.0 µmol total lipid in 200 µL mineral oil (20 mM).
Film composition, per vial
Table 5:Lipid film composition, one vial per reaction condition.
| Lipid | Mole % | Stock (mM) | Volume (µL) | Amount (µmol) |
|---|---|---|---|---|
| POPC | 89.9 | 32.9 | 109.3 | 3.596 |
| Cholesterol | 10.0 | 50 | 8.0 | 0.400 |
| 18:1 Liss Rhod PE | 0.1 | 0.77 | 5.2 | 0.004 |
| Total | 100 | — | 122.5 | 4.000 |
Prepare one vial per reaction condition. Final lipid in oil: 4.0 µmol / 200 µL = 20 mM.
Steps
Combine the chloroform lipid stocks at the volumes above in the bottom of a glass vial. Use glass syringes; chloroform will leach plasticizer from plastic tips.
Dry under a gentle nitrogen stream, rotating the vial, until a uniform thin film has formed across the bottom.
Place in a vacuum oven (or desiccator) overnight, or at minimum a few hours, to remove residual chloroform.
Add 200 µL BioUltra mineral oil directly on top of the film.
Vortex briefly, then heat 30 min at 80 °C on a hot plate.
Vortex 5–10 s. If film is still visible on the glass, return to the hot plate for another 10 min and repeat until no film remains.
Cool the lipid/oil mixture on ice before use. Use the same day.
Part 2 — Inner solution
Three conditions: no-DNA floor, unrepressed ceiling, and the repressed TetR sensor. Condition 3 is made at a larger volume because it feeds four aTc levels.
Condition definitions
Table 6:The three inner solutions.
| 1 — No DNA | 2 — Unrepressed | 3 — TetR sensor | |
|---|---|---|---|
| TetR (final) | 0 nM | 0 nM | 1000 nM |
| Plasmid (final) | 0 nM | 1 nM | 1 nM |
| Purpose | Autofluorescence floor | Expression ceiling | aTc dose-response |
Shared master mix
All three conditions take the same master mix, so it is batched once and split. The three conditions need 310 µL of reaction (90 + 90 + 130); this batch is made to 335 µL to carry 25 µL of overage for pipetting loss and dead volume.
Table 7:Shared master mix, batched to 335 µL of reaction.
| Component | Volume (µL) | Fraction of reaction |
|---|---|---|
| Smix | 100.5 | 30% |
| tRNA | 33.5 | 10% |
| Pmix | 40.2 | 12% |
| Ribosomes | 60.3 | 18% |
| RIM | 17.42 | 5.2% |
| Sucrose (45.6 mg solid) | 29.48 | 8.8% |
| Total master mix | 281.4 | 84% |
Sucrose is dosed at 3.4 mg per 25 µL of reaction, so 335 µL of reaction needs 45.6 mg. The 29.48 µL in the table is the volume the dissolved solid contributes, not a volume pipetted from a stock. After dispensing 75.6, 75.6, and 109.2 µL to the three conditions, roughly 21 µL of master mix is left over.
Order of addition. Weigh out the 45.6 mg of solid sucrose first and vortex it into the Smix until fully dissolved. Only then add the remaining components in the order listed — tRNA, Pmix, ribosomes, RIM. Dissolving sucrose into the full mix instead risks prolonged vortexing against the ribosomes and translation factors.
Assembly, volumes in µL
Table 8:Inner solution assembly, volumes in µL.
| Component | 1 | 2 | 3 |
|---|---|---|---|
| Smix | 27.0 | 27.0 | 39.0 |
| tRNA | 9.0 | 9.0 | 13.0 |
| Pmix | 10.8 | 10.8 | 15.6 |
| Ribosomes | 16.2 | 16.2 | 23.4 |
| RIM | 4.68 | 4.68 | 6.76 |
| Sucrose | 7.92 | 7.92 | 11.44 |
| Master mix subtotal | 75.6 | 75.6 | 109.2 |
| Plasmid DNA | 0 | 0.9 | 1.3 |
| TetR | 0 | 0 | 13.0 |
| Nuclease-free water | 14.4 | 13.5 | 6.5 |
| Total | 90.0 | 90.0 | 130.0 |
Steps
Thaw all cell-free components on ice. Keep them on ice throughout; do not let the assembled mix warm before encapsulation.
Combine the plasmid DNA, TetR, and nuclease-free water for each condition in its own tube, at the volumes in the table above. Incubate 10 min at 37 °C so TetR binds the tetO operator before transcription can begin. Condition 1 is water only, but carry it through the same incubation.
Prepare the shared master mix as above and add it to each pre-incubated tube: 75.6, 75.6, and 109.2 µL for conditions 1, 2, and 3. Mix by gentle pipetting — do not vortex the assembled reaction.
Hold on ice and proceed immediately to Part 4. Reserve 10 µL per bulk control well (Part 6) before encapsulating.
Part 3 — Outer solution
The outer solution is glucose-based so that the sucrose-loaded inner droplets are denser than the surrounding phase and pellet through the interface during centrifugation.
Table 9:Outer solution, per 1000 µL.
| Component | Stock | Volume (µL) | Resulting concentration |
|---|---|---|---|
| Glucose | 2 M | 200 | 400 mM |
| HEPES | 1 M | 800 | 800 mM |
| Water | — | 0 | — |
| Total | 1000 |
Check this before running. As written, 800 µL of 1 M HEPES gives 800 mM HEPES, which is far above a normal buffer concentration and would badly overshoot the inner solution osmolarity. The likely intent is a lower HEPES stock or a much smaller HEPES volume with water to 1000 µL. See open items.
Prepare ~200 µL outer solution per condition: 100 µL as the receiving layer and 100 µL for resuspension. Match the outer osmolarity to the inner solution; a mismatch will shrink or burst the vesicles.
Part 4 — Emulsion transfer and vesicle recovery
Work cold and quickly. Everything from here until imaging should be kept on ice.
Add 20 µL inner solution to the cold lipid/oil mixture.
Vortex 30 s to generate the water-in-oil emulsion. Incubate on ice 5 min so the lipid monolayer stabilizes around the droplets.
Carefully layer the emulsion on top of 100 µL outer solution. Pipette down the tube wall — do not let the emulsion punch through the interface.
Incubate on ice 5 min to let the oil/water interface equilibrate and acquire its monolayer.
In parallel, block glass slides or wells with 2% w/v BSA for at least 20 min.
Centrifuge 15 min at 18,000 rcf, 4 °C. Droplets cross the interface and complete the outer leaflet.
Remove as much mineral oil from the top as possible without disturbing the interface.
With a fresh tip, collect the vesicle pellet from the bottom of the tube.
Resuspend each pellet in 200 µL outer solution.
Remove BSA from the wells, rinse, and load 20 µL the vesicles for imaging.
Part 5 — Plate setup and imaging
Vesicles are imaged in a 384-well glass-bottom plate, BSA-blocked. Each well receives 20 µL final reaction plus 2 µL aTc, and each condition is run in duplicate (columns 5 and 6).
Layout, 384-well glass-bottom plate
Table 10:Microscopy plate layout. Twelve conditions in duplicate.
| Row | Condition | aTc level | Col 5 | Col 6 |
|---|---|---|---|---|
| C | No DNA | 0 | ✓ | ✓ |
| D | No DNA | 0.25 | ✓ | ✓ |
| E | No DNA | 0.5 | ✓ | ✓ |
| F | No DNA | 1 | ✓ | ✓ |
| G | Unrepressed | 0 | ✓ | ✓ |
| H | Unrepressed | 0.25 | ✓ | ✓ |
| I | Unrepressed | 0.5 | ✓ | ✓ |
| J | Unrepressed | 1 | ✓ | ✓ |
| K | 1000 nM TetR | 0 | ✓ | ✓ |
| L | 1000 nM TetR | 0.25 | ✓ | ✓ |
| M | 1000 nM TetR | 0.5 | ✓ | ✓ |
| N | 1000 nM TetR | 1 | ✓ | ✓ |
Twelve conditions × 2 replicates = 24 wells. Row B of the original layout carried an unrelated in-gel PEG-NB entry and is not part of this experiment.
Steps
Block the glass-bottom wells with 2% w/v BSA for ≥20 min, then remove and rinse with outer solution.
Dispense 20 µL of resuspended vesicles per well.
Add 2 µL aTc at the level for that row. Mix by gentle pipetting only.
Let vesicles settle to the glass before imaging.
Acquire rhodamine and GFP channels at each timepoint, with identical settings across all wells. Set exposure on the brightest expected well (unrepressed, high aTc) so nothing saturates.
Score GFP only inside objects with a continuous rhodamine rim.
Part 6 — Bulk unencapsulated control
Run the same three inner solutions unencapsulated, so that a failure to express can be told apart from a failure to encapsulate.
Before emulsification, reserve inner solution from each condition.
Plate 10 µL per well in a 384-well black plate, matching the same 12 condition × aTc combinations.
Add aTc to match the microscopy plate, scaled to the 10 µL volume.
Read GFP fluorescence kinetically on the plate reader at 30 °C or 37 °C, with reads every 5–10 min for 3–6 h.
If the bulk reaction shows aTc-dependent GFP but the vesicles do not, the problem is in encapsulation or vesicle integrity, not in the circuit.
Plasmid reference — pOpen-TetO-deGFP
The expression cassette places the tetO operator immediately downstream of the T7 promoter, so bound TetR occludes the polymerase at initiation rather than acting as a roadblock during elongation.
Table 11:Elements of pOpen-TetO-deGFP.
| Element | Sequence landmark | Function |
|---|---|---|
| T7 promoter | TAATACGACTCACTATAGGG | Transcription start, T7 RNAP |
| tetO operator | TCCCTATCAGTGATAGAGA | TetR binding site; aTc-releasable |
| T7 g10 leader + RBS | AAGGAGATATACAT | Ribosome binding |
| deGFP CDS | atggagcttttcactggc… | Reporter, ~700 bp |
| T7 terminator | …tagagaccgagataacagatacttcggtatctgttatctgtt | Transcription stop |
| AmpR (bla) | — | Selection marker |
| pUC origin | — | Plasmid replication |
The terminator and backbone sequences are not transcribed in the cell-free reaction, but the full sequence is kept here so the construct is traceable from the protocol.
Results
Bulk. The aTc titration was not clean above 0.25 µM, but the circuit itself behaved as designed: TetR gave strong repression, and aTc relieved it. In the unrepressed reaction deGFP reached 41,800 RFU by 6 h, against a no-DNA floor of 296 RFU. Adding 1000 nM TetR dropped expression to 4,100 RFU, a 9.8-fold repression ratio. aTc restored expression dose-dependently from 0 to 0.25 µM (3.3-fold), after which the titration became non-monotonic — the 0.5 µM replicates disagreed 2.3-fold (21,306 vs 9,423 RFU, 55% CV, where every other pair was under 12%), and 1 µM fell below 0.25 µM. aTc toxicity does not account for this: the unrepressed wells at 1 µM aTc matched those at 0 µM, so aTc is not inhibiting the reaction. All conditions plateaued by ~3 h.

Figure 1:Figure 1. Kinetics of deGFP expression from pOpen-TetO-deGFP in bulk PURE reactions. Fluorescence (485/20 ex, 528/20 em, gain 50) read every 5 min for 6 h at 37 °C. Conditions: no-DNA control, unrepressed (1 nM plasmid), and 1 nM plasmid + 1000 nM TetR across 0–1 µM aTc. n = 2 wells per condition.

Figure 2:Figure 2. Endpoint deGFP fluorescence at 6 h, from the kinetic run in Figure 1. Individual replicates shown; n = 2 wells per condition.
Encapsulated. GUVs were imaged over 4 h in two formats: embedded in PEG-NB hydrogel (left two columns) and free in solution (right two columns, duplicate). The in-gel images are dominated by scattering background and are not interpretable for expression. The in-solution samples show the expected behavior — no-DNA vesicles stayed dark throughout, unrepressed vesicles became strongly fluorescent, the 0 µM aTc condition remained repressed, and lumen deGFP increased with aTc concentration.
Figure 3. Images of GUVs over 4 h. Membrane labeled with Cy5.5-PE; deGFP in the GFP channel. Left two columns, GUVs in PEG-NB hydrogel; right two columns, duplicate samples in solution.
/usr/local/lib/python3.13/dist-packages/cdk/analysis/cell/analysis.py:263: FutureWarning: The default of observed=False is deprecated and will be changed to True in a future version of pandas. Pass observed=False to retain current behavior or observed=True to adopt the future default and silence this warning.
  data.groupby(list(by))[value].quantile(list(QUANTILES)).unstack()
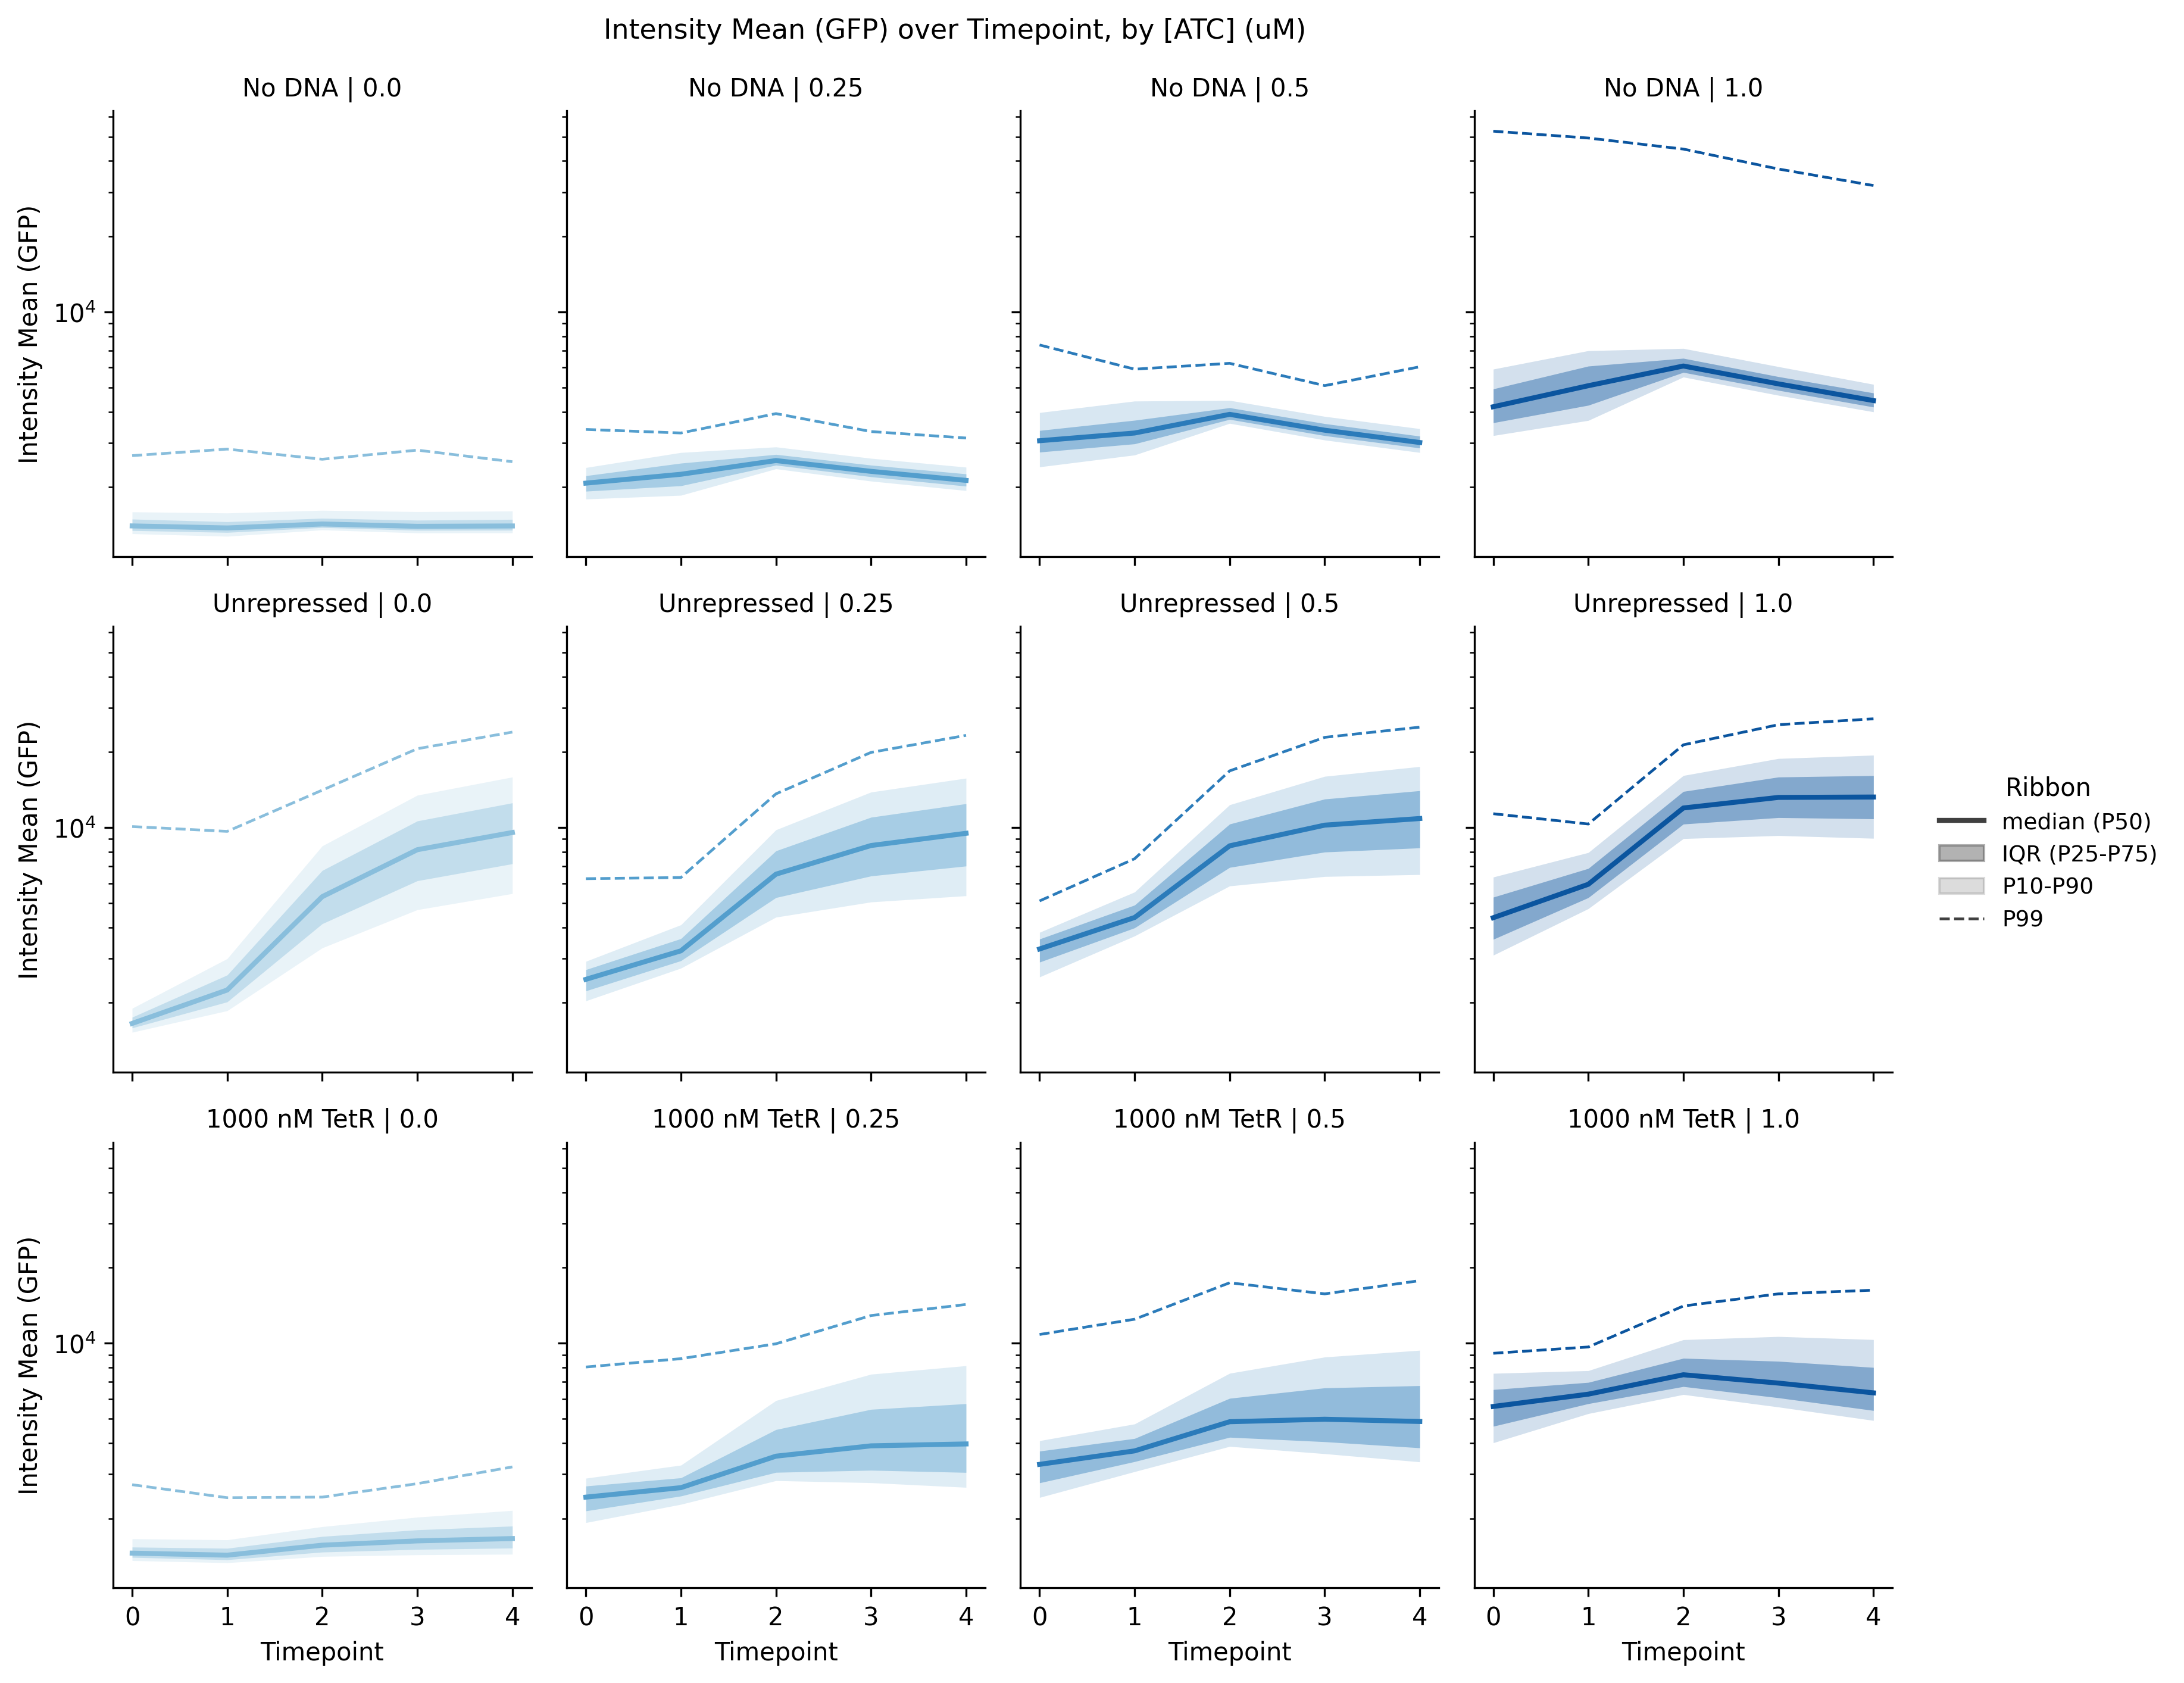
Figure 3:Figure 4. Lumen deGFP fluorescence in solution-phase GUVs over 4 h. Each point is mean per-vesicle intensity. 2 technical replicates per condition.
/usr/local/lib/python3.13/dist-packages/cdk/analysis/cell/analysis.py:263: FutureWarning: The default of observed=False is deprecated and will be changed to True in a future version of pandas. Pass observed=False to retain current behavior or observed=True to adopt the future default and silence this warning.
  data.groupby(list(by))[value].quantile(list(QUANTILES)).unstack()
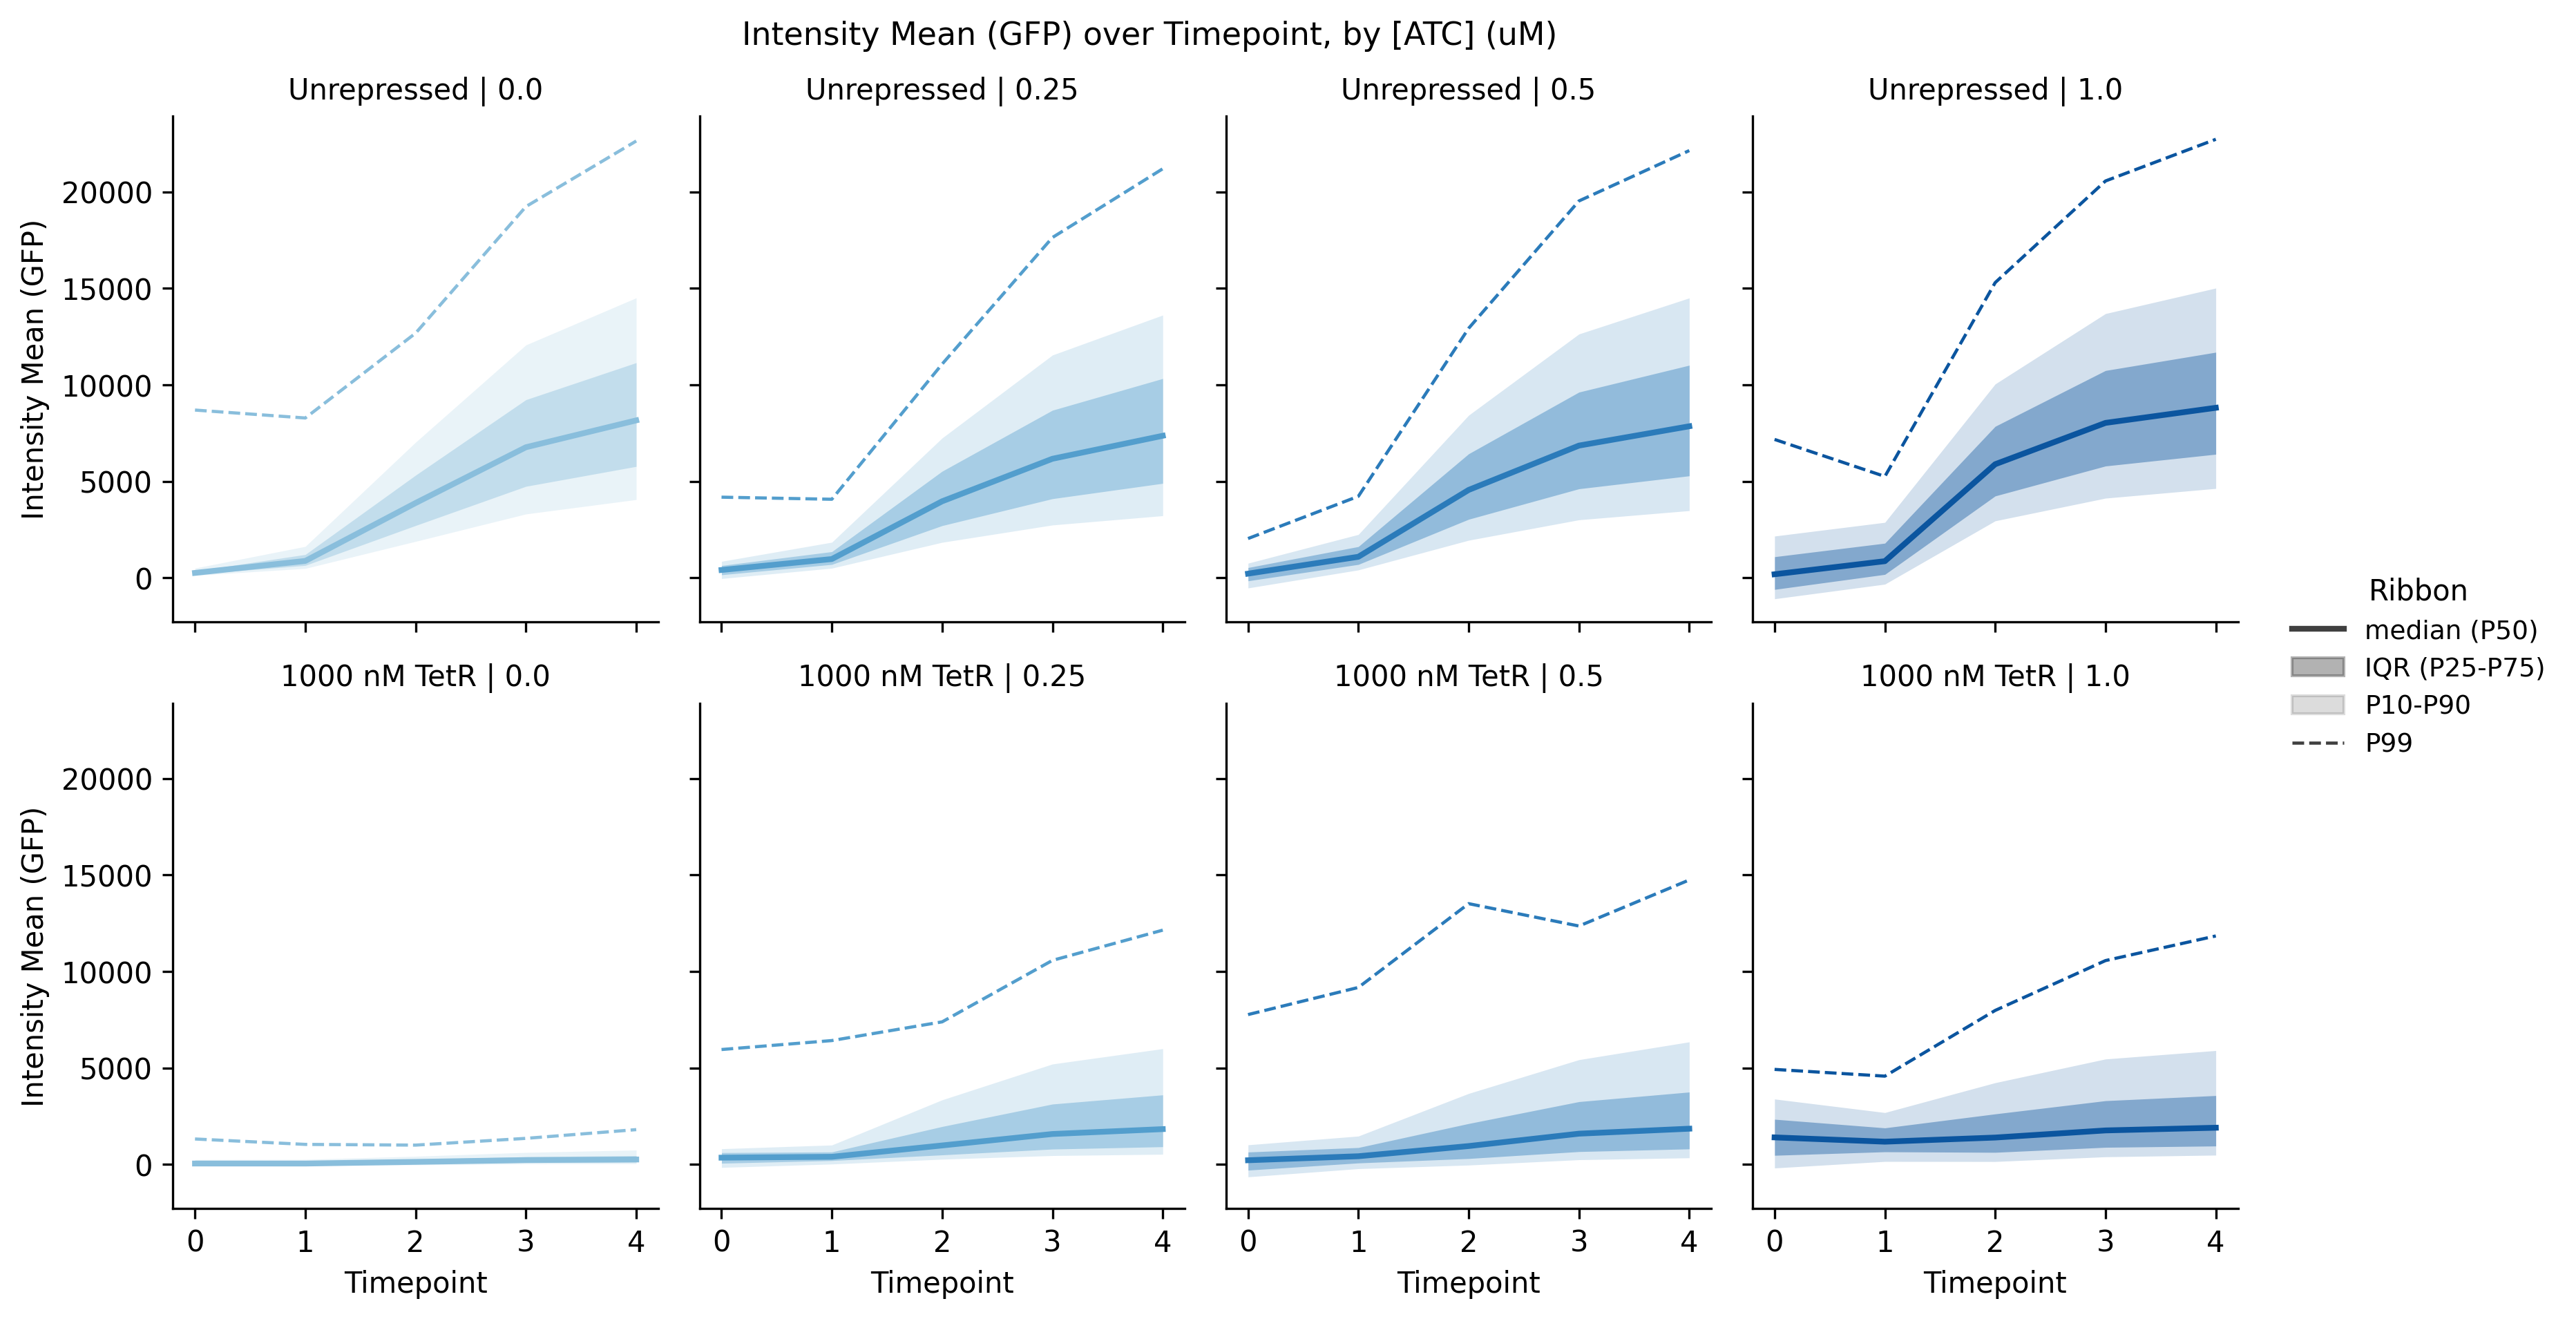
Figure 4:Figure 5. Background-subtracted quantification of Figure 4. aTc is autofluorescent in the GFP channel and raises background in proportion to dose, so the matched no-DNA control at each aTc concentration was subtracted from every condition.
Conclusion
deGFP expressed robustly in bulk PURE and after encapsulation in GUVs. TetR repressed the sensor effectively in both formats — 9.8-fold in bulk — and aTc relieved repression in both. In GUVs, induction increased with aTc up to 1 µM, the highest dose tested.