


DNA toolkit - The T7 promoter collection
Abstract
DNA is vital for testing and developing PURE cell-free expression systems, yet a dedicated DNA resource specific to PURE does not exist. To address this, we introduce the DNA toolkit - a well-characterised set of DNA parts designed and tested for PURE and available to the community. This will enable us to collectively build a DNA part library for engineering PURE systems while also defining key DNA design considerations for PURE. We begin by characterising the T7 promoter collection, a library of 9 promoters that express over a broad dynamic range and can be categorised into three functional expression levels. This characterisation, performed using three different reporter proteins (amajLime, deGFP, and plamGFP), also sheds light on important considerations for reporter choice in PURE quantification.
Background
DNA is an important component of PURE cell-free expression systems providing the instructions to drive protein production. DNA is therefore paramount in both PURE development and testing, and its application in synthetic cell engineering. For example, the gold standard of PURE quantification is through fluorescent protein expression1, and synthetic cells more frequently encapsulate PURE to provide functionality2. However, there is not yet a DNA resource specific to PURE from which the community can draw. The DNA toolkit seeks to address this through providing a well-characterised set of DNA parts accessible to the community through the Nucleus Distribution. This aims to both simplify and standardize DNA construct design, benefitting PURE and synthetic cell development, and enabling the community to more efficiently establish DNA design considerations specifically for PURE.
Here we present the T7 promoter collection as the first entry to the DNA toolkit. Promoters are regulatory elements that control DNA transcription, the first operation of gene expression involving the decoding of DNA into RNA before its subsequent translation into protein. Tight regulation of transcription is desirable in PURE as it has a direct correlation to protein yield, and if referring to synthetic cells, the overall function to which that protein imparts on the cell. More importantly, without transcriptional control, we will be unable to orchestrate the expression of multiple proteins within PURE preventing us from reconstituting the complexity of living systems.
Towards this goal, we have quantified the performance of nine different T7 promoter sequences in PURE using three distinct reporter proteins: amajLime, deGFP, and plamGFP. By utilising a selection of reporter proteins we were also able to gain insight into the considerations of reporter choice for PURE quantification.
The T7 Promoter Collection
The T7 promoter collection (Table 1) was originally curated by Jackson-Smith and was selected across two different libraries - the phage T7 phage genome engineered by Chan, Kosuri and Endy3, and the T7 promoter variant library constructed and tested in vitro by Komura, et al 4. The collection was built to expand the PURE DNA toolbox allowing for greater control over the transcriptional machinery. Promoter sequences were chosen to span a broad dynamic range enabling the design of multi-gene DNA constructs with varied protein expression levels. This would advance PURE gene expression away from the co-expression of individual DNA molecules towards small genomes encoded on a single template.
Table 1:T7 promoter sequences and their relative expression levels. Bases shown in bold represent mutations relative to the consensus T7 promoter sequence
| Promoter | Relative expression level | Sequence 5’-3’ | No. of mutations | |||
|---|---|---|---|---|---|---|
| T7-1 | Low | TAATATCACTGACTAAAGT | 5 | |||
| T7-3 | Medium | TGAAACGACTCACTTTAGG | 3 | |||
| T7-4 | Low | TTATACGTGTCCCTGTAGG | 5 | |||
| T7-5 | Medium | GAATACGCCTCACTTTAGG | 3 | |||
| T7-6 | Medium | CAATACGTCTCACTATAGC | 3 | |||
| T7-7 | Medium | TTATACGACTCAGTATAGT | 3 | |||
| T7-8 | High | CGATACGACTCACTATAGG | 2 | |||
| T7-9 | High | GAATACGACTCACTATAGG | 1 | |||
| T7-10 | High | TAATACGACTCACTAAAGG | 1 |
To enable quantification of the promoter collection, each promoter sequence was cloned upstream of a different fluorescent reporter. The expression of the fluorescent reporter could then be detected using a spectrophotometer. Promoters were cloned via PCR using universal primers which exploited the homologous 5’UTRs of the fluorescent reporters. After amplification, samples were column purified, DpnI digested to remove template plasmids, and then re-column purified to generate high quality templates for PURE.
Fluorescent Reporters
Fluorescent proteins have a unique set of properties that govern the way they interact with light. Their excitation and emission wavelengths determine their colour. The difference in these two values being known as the Stokes shift; an important consideration for defining measurement parameters. Brightness is a value assigned to the product of the proteins’ molar extinction coefficient and quantum yield. These values describe how strongly a protein is able to absorb photons, and the ratio to which photons are absorbed vs. emitted. Finally, maturation half-time reports on the time taken for a newly translated protein to be in an excitable state. By quantifying the promoter collection with three distinct proteins, we aimed to gain an insight into how these properties should inform reporter choice in PURE (Table 2).
| Property | amajLime | plamGFP | deGFP | |||
|---|---|---|---|---|---|---|
| Color | Cyan | Green | Green | |||
| Peak excitation (nm) | 458 | 502 | 488 | |||
| Peak emission (nm) | 486 | 514 | 512 | |||
| Stokes shift (nm) | 28 | 13 | 24 | |||
| Extinction coefficient (M-1cm-1) | 40,000 | 98,600 | 55,900 | |||
| Quantum yield | 0.24 | 0.96 | 0.6 | |||
| Brightness | 9.6 | 94.7 | 33.5 | |||
| Maturation half-time | 12-48hrs 8 | ??? | 7-8 mins |
The three proteins exhibit reasonable diversity in their origins and characteristics. amajLime and plamGFP are native fluorescent proteins derived from sea coral species, Anemonia majano and Platygyra lamellina, respectively. deGFP is an engineered variant of the Aequorea victoria-derived eGFP. It is important to note that all DNA sequences were codon optimised for PURE ribosomes to minimise any species-related translation bias.
Their features also vary. plamGFP is exceptionally bright, whereas amajLime has low brightness but is uniquely also a chromoprotein meaning it is visible in ambient light. deGFP has average brightness but its sequence was specifically optimised for PURE cell-free systems. It is a smaller, N- and C-terminally truncated protein expressed from an mRNA with minimal secondary structure leading to faster maturation and a higher expression efficiency. While maturation half-time data for plamGFP is unavailable, we expect it to be closer to that of amajLime than deGFP, given their shared native origin and lack of engineering.
Promoter performance
The promoter collection was quantified in triplicate using 10 µL PURExpress reactions each containing DNA at a concentration of 5 ng/µL. A single experimentalist quantified the amajLime constructs (CN) whereas two experimentalists quantified the plamGFP/deGFP constructs (CN & AJ). The amajLime data was derived from a single endpoint measurement in comparison to timecourse measurements taken for plamGFP/deGFP. As such, the plamGFP/deGFP analysis is more thorough. Prior to quantification, excitation/emission parameters were optimised using our spectrophotometer for each reporter by performing a spectral scan on reactions that had gone to full completion. Once peak excitation emission values were identified, measurement bandwidths were adjusted to minimise noise generated from spectral overlaps. Experiments were run for ≥12 hours with 5 min kinetic intervals at 37 ˚C in a BioTek cytation 5 spectrophotometer. Ex/Em | bandwidth: amajLime 454nm/488nm | 20nm, plamGFP/deGFP 485nm/512nm | 17nm.
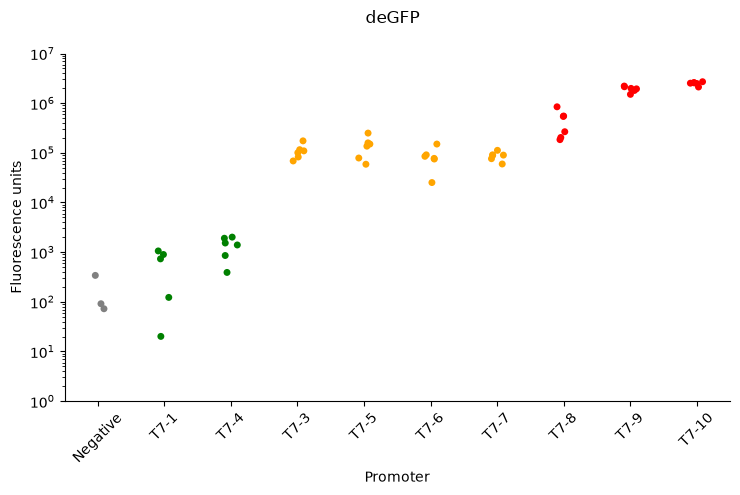
Figure 1:Steadystate fluorescence values of deGFP expression under the control of the T7 promoter collection. All values were background subtracted prior to plotting. Reaction duration: 12 hrs.
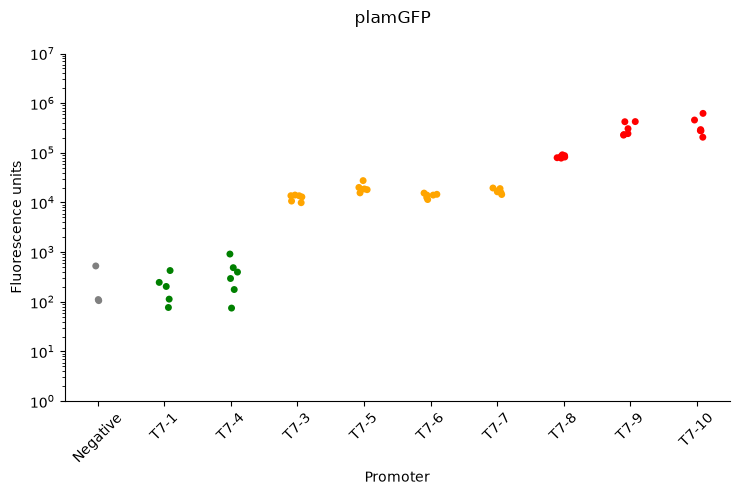
Figure 2:Steadystate fluorescence values of plamGFP expression under the control of the T7 promoter collection. All values were background subtracted prior to plotting. Reaction duration: 12 hrs.
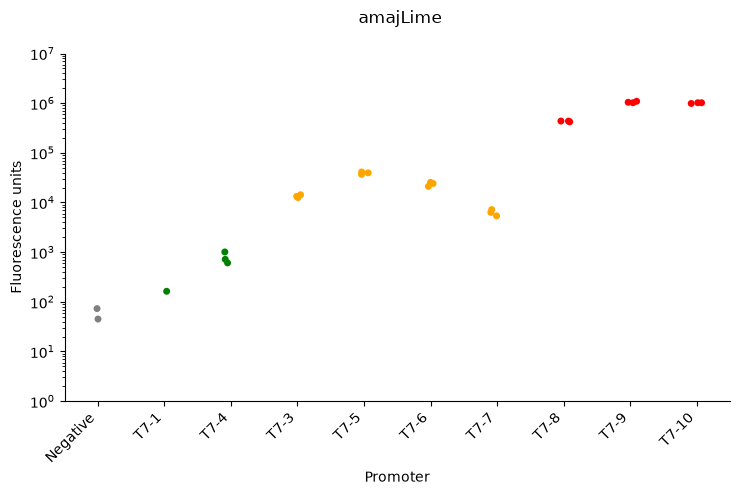
Figure 3:Endpoint fluorescence values of amajLime expression under the control of the T7 promoter collection. All values were background subtracted prior to plotting. Reaction duration: 14 hrs.
The summary data informs us that the T7 promoter collection spans a ~1000-fold dynamic range of expression (Figure 1). Promoters can be categorized into low, medium, and high expression level groups as denoted by the colored markers. These expression groups appear to directly correspond with the number of mutations present in the promoter sequences in comparison to the consensus sequence. Low expression promoters possess five mutations, medium promoters possess three mutations, and high promoters possess one or two mutations (Table 1). With this in mind, it may be possible to define a fourth expression level group between medium and high expression level promoters to house T7-8.
Whilst all reporters exhibit a similar dynamic range, deGFP appears to be the only reporter in which both of the low expression group promoters can be distinguished from the background signal. AmajLime and plamGFP have either T7-1 or both T7-1 and T7-4 within the background noise. This may be due to the difference in spectral properties of the proteins. In theory, plamGFP is reported to be the brightest of the three reporters and yet it is consistently detected at an order of magnitude lower than amajLime or deGFP. We assume that the smaller Stokes shift of plamGFP may play a role in this as it prevented us from measuring the reporter close to its optimum Ex/Em values. In fact, the optimum values were conveniently found to be very similar to deGFP at 485nm/512nm enabling us to measure the plamGFP and deGFP on the same plate. Moving the Ex/Em values closer to the optimum values of 502nm/514nm either resulted in a negligible increase, or a decrease in signal detection. The small Stokes shift of plamGFP may therefore prevent full exploitation of the reported brightness of the molecule.
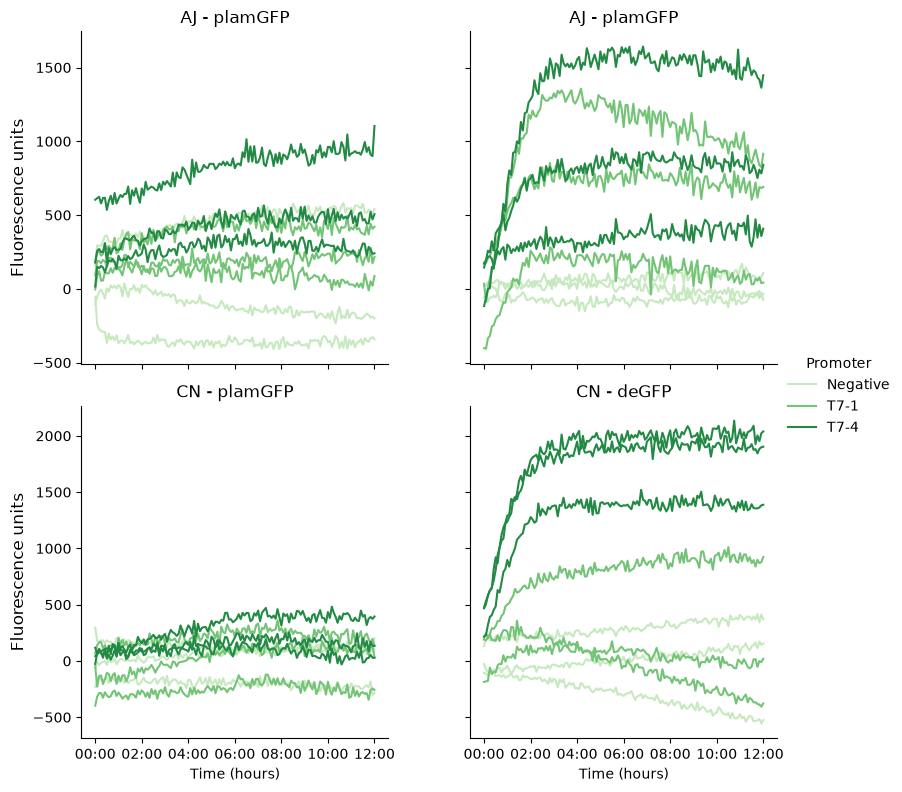
Figure 4:Low expression promoters - Each curve represents a single PURE replicate containing a promoter sequence controlling the expression of either plamGFP, or deGFP. The data from each row of figures was generated by either Astrid Joergensen (Top), or Charlie Newell (Bottom).
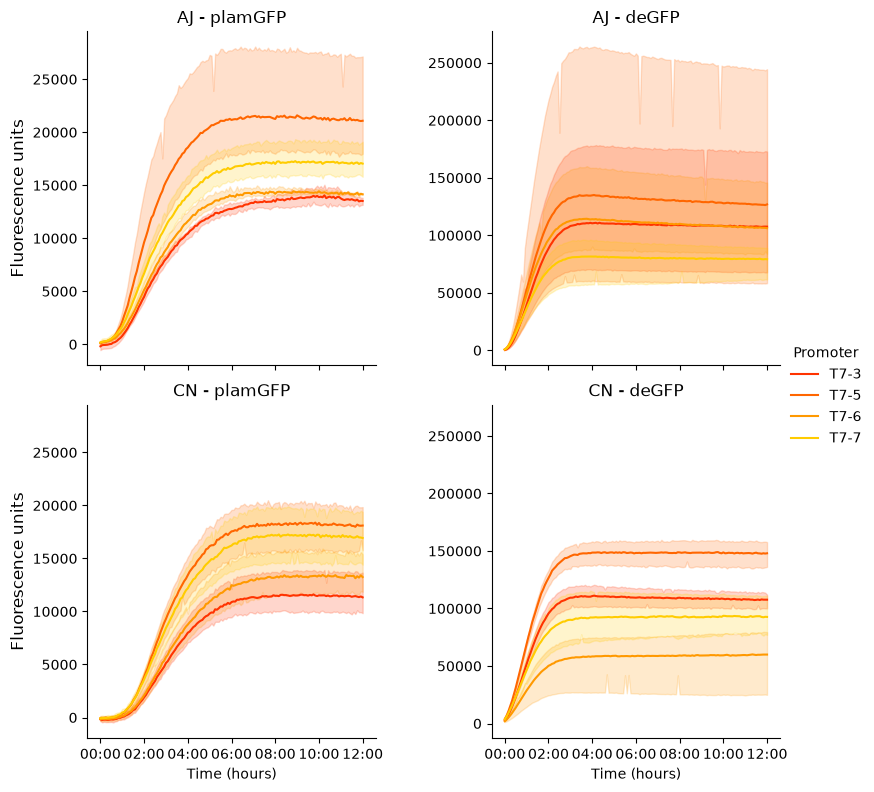
Figure 5:Medium expression promoters - Each curve represents a single PURE replicate containing a promoter sequence controlling the expression of either plamGFP, or deGFP. The data from each row of figures was generated by either Astrid Joergensen (Top), or Charlie Newell (Bottom).
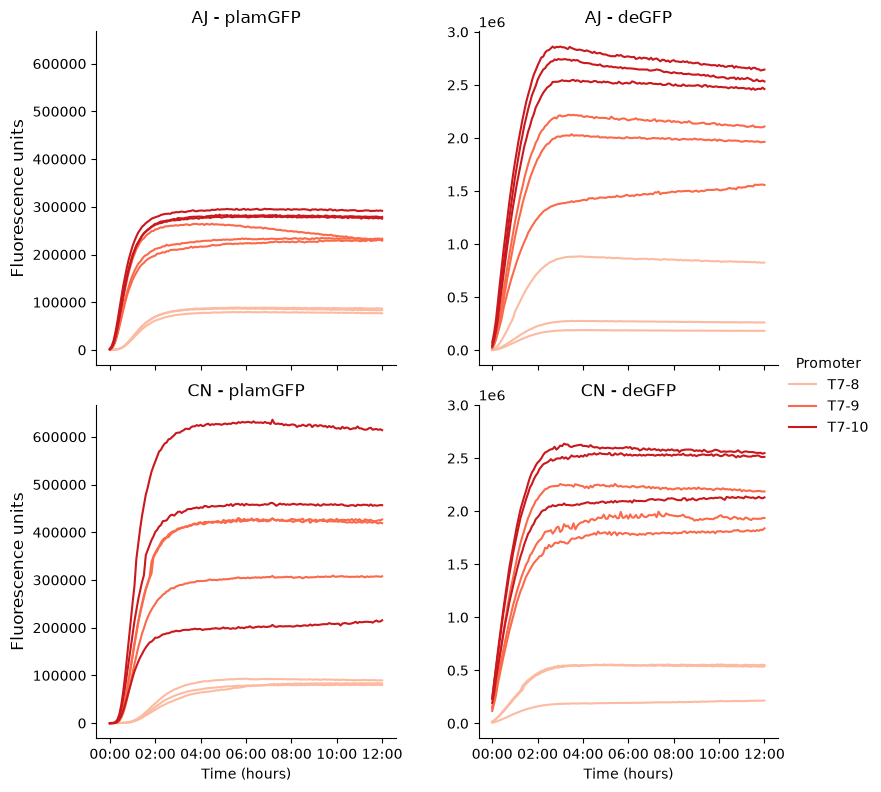
Figure 6:High expression promoters - Each curve represents a single PURE replicate containing a promoter sequence controlling the expression of either plamGFP, or deGFP. The data from each row of figures was generated by either Astrid Joergensen (Top), or Charlie Newell (Bottom).
Kinetic data from the plamGFP/deGFP constructs provides deeper insight into the expression characteristics of each promoter group. When observing the low expression group curves, the lack of clear distinction between the promoter signals and the negative noise in the plamGFP data again highlights its reduced sensitivity as a reporter (Figure 4). Despite this, the curves confirm the activity of T7-1 and T7-4 as functional promoters with T7-4 being the strongest. We can confirm the activity of both promoters due to the appearance of the latter phase of a sigmoidal curve in the deGFP samples. It is important to note here that signal detection began ~ 15mins after the reaction was placed at 37˚C which may explain the lack of the lag phase of the S-curve.
The medium and high expression group curves continue to show the disparity in sensitivity between reporters by virtue of a ~10-fold difference in fluorescence signal. There is not a clear distinction in promoter activity in the medium expression group demonstrated by a significant overlap of standard deviation values between all samples for each reporter (Figure 5). The middle expression group therefore represents a sub-collection of 4 promoters with similar expression levels. These sequences may be useful when engineering multi-gene constructs in which several proteins need to be expressed at similar abundances. Multiple promoters with minor sequence variations may limit the chance of homologous recombination that would otherwise occur when assembling multiple identical sequences. The curves of the high expression group highlight the relationship between amount of sequence mutations and promoter expression level (Figure 6). T7-8 is isolated and below T7-9 and T7-10 which are clustered together.
Conclusions and Future Directions
The T7 promoter collection consists of 9 promoters which span a ~1000-fold dynamic range of expression. Promoter sequences can be categorized into low, medium, and high expression level groups corresponding to their relative abundance of point mutations in comparison to the consensus T7 promoter sequence. It may be possible to exploit this relationship to design more T7 promoter sequences across all groups to increase the breadth of the collection.
deGFP is a more optimal fluorescent protein for reporting on PURE performance than amajLime or plamGFP. The brightness of a fluorescent reporter should not be used a single characteristic to determine reporter choice for PURE. A holistic approach should be taken whereby all spectral and photophysical characteristics including Stokes shift and maturation half-time are considered. It is encouraged to always experimentally test a reporter protein prior to integrating it in a system for PURE quantification.
Whilst this has provided insight into the considerations for choosing a reporter protein for PURE, RNA aptamer reporters may be more accurate in quantifying promoter performance. Fluorescent RNA aptamers bind to small molecule dyes with high affinity causing them to fluoresce. This directly couples DNA transcription to the generation of a fluorescent signal removing the latency involved in protein translation and the subsequent maturation of the chromophore. Future work will aim to characterise the T7 promoter collection using aptamers providing insight into the best practices for PURE quantification.
Acknowledgments
This work is part of the project titled “Developer Cell: A modular, extensible chassis for building synthetic cells,” and is funded in part by the Alfred P. Sloan Foundation under grant G-2024-22735.
- Yadav, S., Perkins, A. J. P., Liyanagedera, S. B. W., Bougas, A., & Laohakunakorn, N. (2025). ATP Regeneration from Pyruvate in the PURE System. ACS Synthetic Biology, 14(1), 247–256. 10.1021/acssynbio.4c00697
- Chan, L. Y., Kosuri, S., & Endy, D. (2005). Refactoring bacteriophage T7. Molecular Systems Biology, 1(1). 10.1038/msb4100025
- Komura, R., Aoki, W., Motone, K., Satomura, A., & Ueda, M. (2018). High-throughput evaluation of T7 promoter variants using biased randomization and DNA barcoding. PLOS ONE, 13(5), e0196905. 10.1371/journal.pone.0196905