20250919-Analysis
!pip install nucleus-cdk==0.5.0rc2 | tail -n2Requirement already satisfied: asttokens in /opt/homebrew/anaconda3/lib/python3.12/site-packages (from stack-data->ipython>=6.1.0->ipywidgets==8.*->jupyter-bokeh<5.0.0,>=4.0.5->nucleus-cdk==0.5.0rc2) (2.0.5)
Requirement already satisfied: pure-eval in /opt/homebrew/anaconda3/lib/python3.12/site-packages (from stack-data->ipython>=6.1.0->ipywidgets==8.*->jupyter-bokeh<5.0.0,>=4.0.5->nucleus-cdk==0.5.0rc2) (0.2.2)
import pandas as pd
import matplotlib.pyplot as plt
import seaborn as sns

from cdk.analysis.cytosol import platereader as pr
import warnings

warnings.filterwarnings('ignore')

pr.plot_setup()
# Initialize plotting
pr.plot_setup()
Load the data
Provide a CSV file containing the data, and a platemap. This function returns both the data with the plate map mapped to it, and the platemap by itself, which is useful for certain tasks.
data_file = "20250919-cytation3-pure-timecourse-gfp-EXPERIMENT-biotek-cdk.txt"
platemap_file = "20250919-ClpXP.csv"

data, platemap = pr.load_platereader_data(data_file, platemap_file)
Basic Analysis
Curves
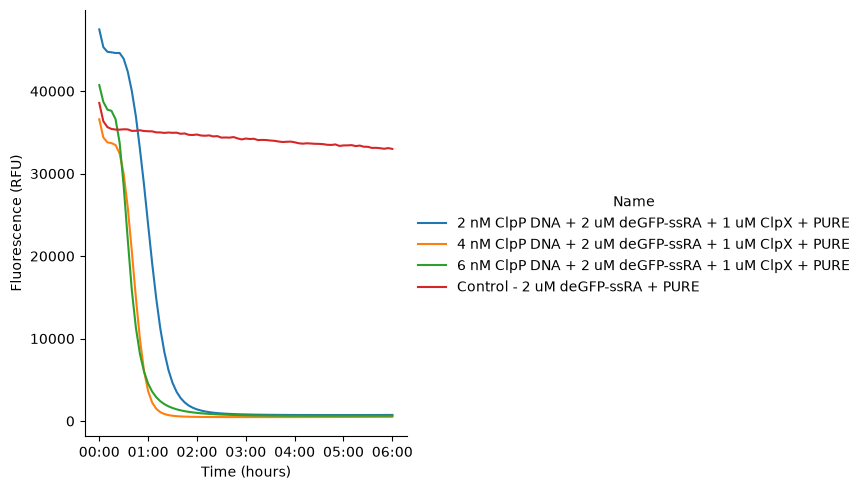
Curves of RFU over time, by named sample.
pr.plot_curves(data);