


Week 1, September 23 to 25
We began DevStudio with a whiteboard exercise asking each participant to diagram their application demonstrations in terms of constituent Modules and Processes (boards). This exercise showed similarities across the proposed demonstrations, highlighted key intermediates, and gave us a means to track progress over the next 22 days. Each node is showing up with two proposed demonstrations. The Chicago Node is running a pH Sensing demonstration and an aTc Sensor demonstration. The London Node is running a LuxR-GFP Sensor demonstration in S30 Lysate and “CRAIC”, a colorimetric reporter for AHL in cytosol.
Using a Nucleus-Skills based workflow we were able to quickly translate the hand-drawn schematic into digital diagrams that we can annotate (pH Sensing, aTc Sensor, LuxR-GFP, and CRAIC). In this case, we’ve annotated Modules and Processes as green if they’ve been successfully implemented as the demonstration requires; orange if the modules or processes have been attempted but they require modification or additional tuning; red if the module or process has been ruled out, whether by choice or by failure, which nothing has been so far; and gray if the module or process remains untouched at DevStudio.
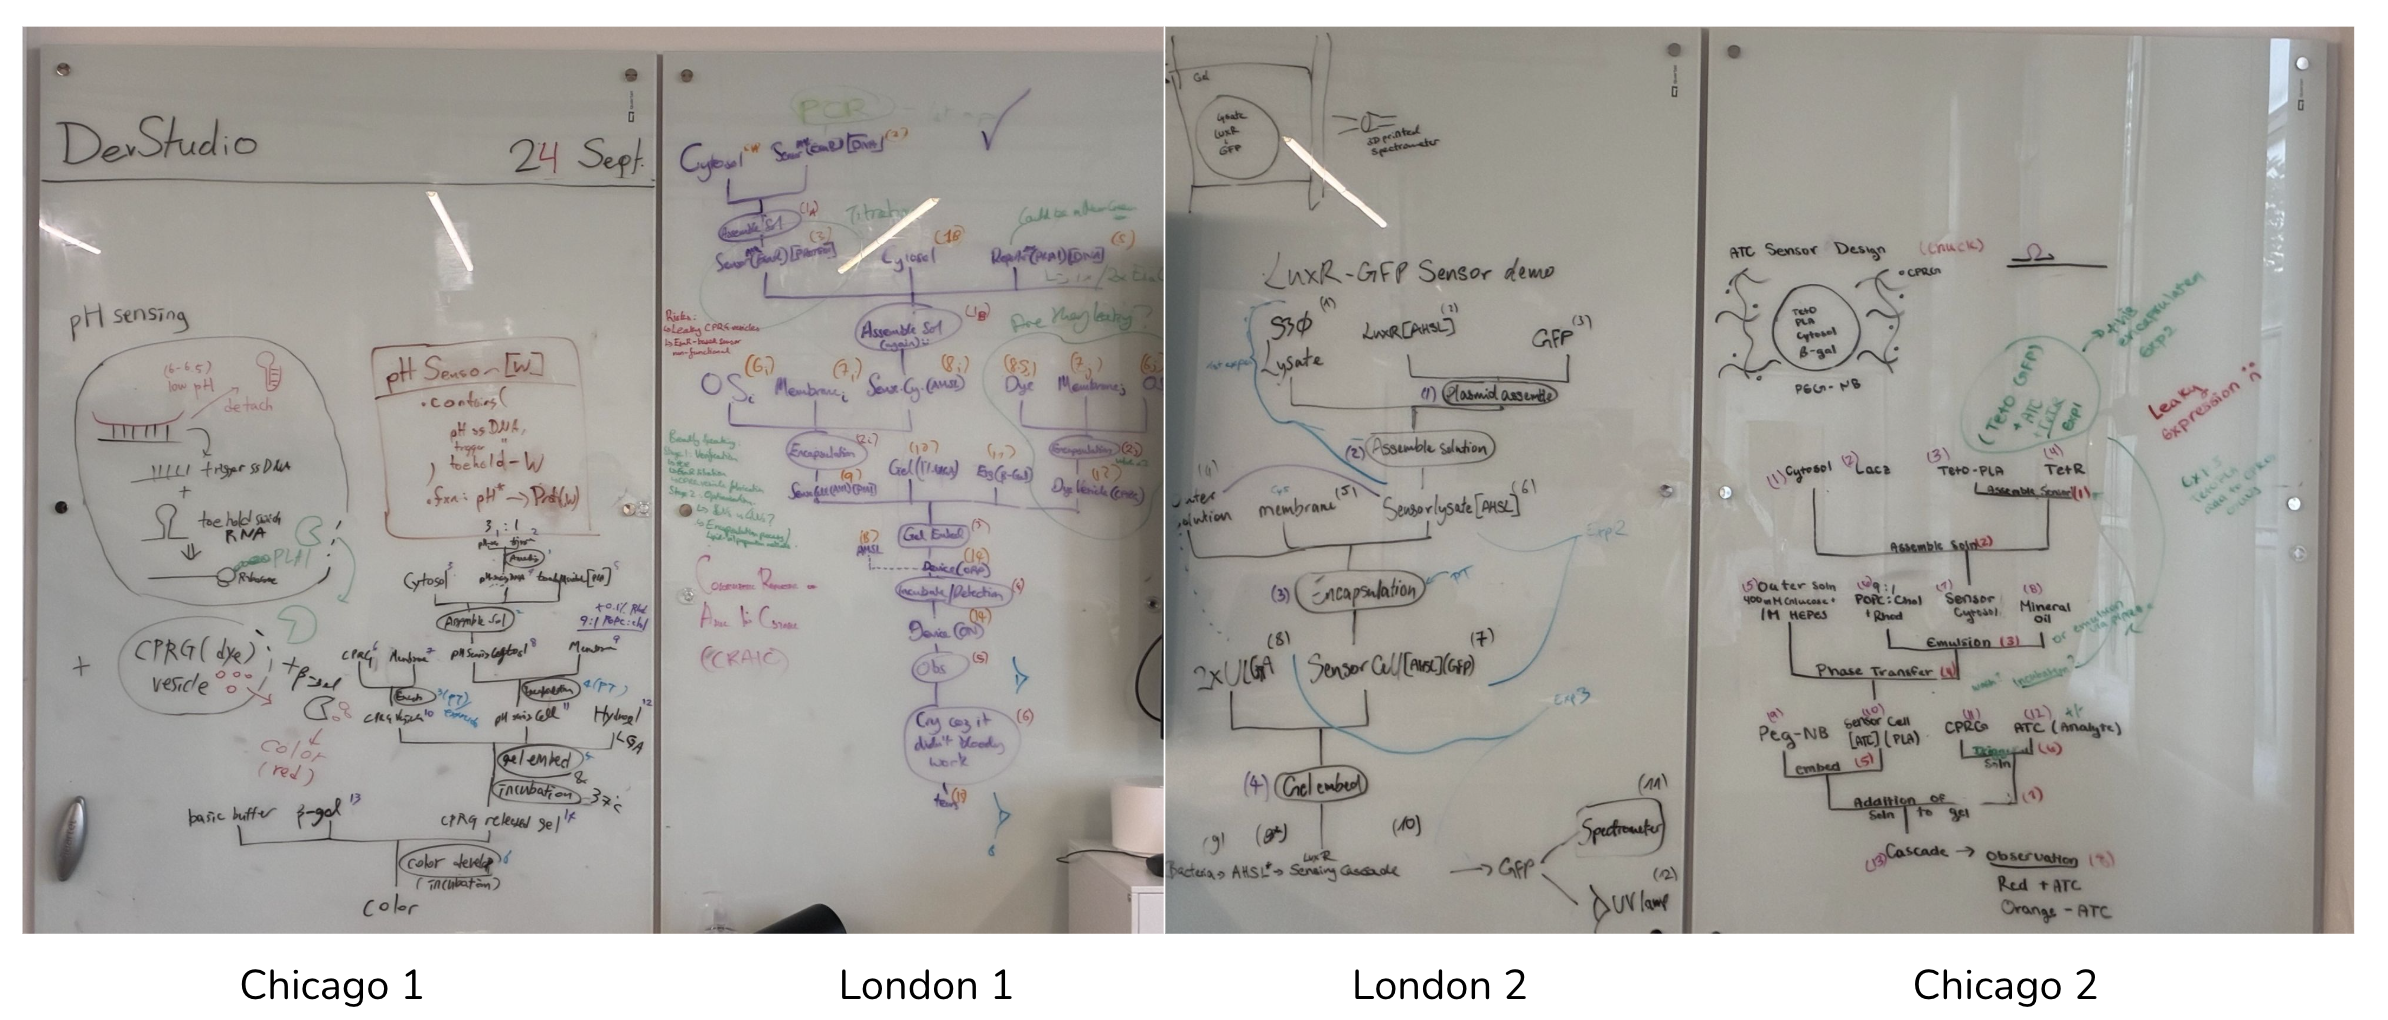
Figure 1:The four demonstration boards as drawn at the end of Day 1. The handwriting is not meant to be read at this size. The boards are reproduced as a record of how the figures below (pH Sensing, aTc Sensor, LuxR-GFP, and CRAIC) were made.
The pH Sensing demonstration releases CPRG from a vesicle when low pH opens a toehold switch that expresses PLA1, giving a color read out of a gel. Status at the end of Week 1: the sensing chain through the pH Sensing Cell is green, the CPRG vesicle branch is orange on unresolved leakiness, and no gel has been used for this demonstration.
The aTc Sensor demonstration uses TetR repression of a TetO-PLA construct, so that aTc triggers lysis and a colorimetric readout from a PEG-norbornene gel. Status at the end of Week 1: repression is being tuned with TetO-GFP as a proxy, so the sensor nodes are orange and everything downstream of them is gray.
The LuxR-GFP Sensor demonstration detects 3OC6-HSL through LuxR in S30 Lysate and reports it as deGFP fluorescence. Status at the end of Week 1: the sensor chain is orange conservatively, because the dose response ran in Nucleus Cytosol rather than the lysate this figure draws, and no Sensing Cell has been encapsulated.
CRAIC, a Colorimetric Reporter for AHL In Cytosol, detects AHSL through EsaR in Nucleus Cytosol and reports it by releasing CPRG from a dye vesicle in a gel. Status at the end of Week 1: no node is green, because mNeon stands in for PLA1 and the dye branch carries the same unresolved leakiness as the pH demonstration.
Data pipeline updates
The path from experimental design to an annotated figure ran end to end for the first time during Week 1 (pipeline). It was useful to be able to flag gaps in compositional information that were missing from log files, e.g. is the concentration reported a stock or final? were the units of a reagent ambiguously labeled? etc. Given this tool, participants then suggested additional information that might be useful to be included in the structured format, such as links to sub-protocols for materials that requires additional preparation steps before making it into the well.

Figure 2:One experiment carried from design to figure. The plate map, the pipetting volumes, and the methods notes are drafted in a shared spreadsheet, where questions are raised and answered in comments against the design itself. The design becomes a standardized annotated table, one row per well, carrying the experiment, the kit, the DNA identifier, and every concentration. The annotated table runs smoothly through the Cell Development Kit to produce an annotated figure (more on that in our next update).
Daily log
Day 1, September 23.
Four routes toward a demonstration were sketched and agreed, with status, feasibility, and risk discussed for each against the three weeks ahead (boards). Participants prepared basic components, including stock solutions and amplified linear templates, and oriented themselves to the lab. With those pieces in place, first experiments were expected on Day 2, which would put the group in a position to start posting DevNotes and documentation early the following week.
Day 2, September 24.
Materials: lipid stocks prepared for use over the next few weeks. Additional maxipreps in preparation.
Cytosol: the AHSL Sensor tested in two implementations, LuxR to GFP in Nucleus Cytosol with and without T7 RNAP, and in S30 Lysate. The EsaR to mNeon Sensor system had a first test in Nucleus Cytosol. The pH Sensor is assembled.
Cells: CPRG-containing liposomes prepared by the LUV method, and synthetic cells containing the pH Sensor prepared.
Gels: no updates.
Day 3, September 25.
Cytosol: DNA concentration tuning of the EsaR to mNeon Sensor system in Nucleus Cytosol. LuxR to GFP in Nucleus Cytosol tested against varying doses of AHL. TetO to plamGFP tested against varying doses of aTc.
Cells: pH Sensor cells expressed PLA and lysed in response to different pH. An assay ran to find whether CPRG-containing vesicles were lysed and amenable to color change by LacZ.
Gels: first cells embedded in PEG-norbornene gels.