


Analysis: 20260612
!pip install nucleus-cdk==0.5.0rc2 | tail -n2Requirement already satisfied: asttokens in /opt/homebrew/anaconda3/lib/python3.12/site-packages (from stack-data->ipython>=6.1.0->ipywidgets==8.*->jupyter-bokeh<5.0.0,>=4.0.5->nucleus-cdk==0.5.0rc2) (2.0.5)
Requirement already satisfied: pure-eval in /opt/homebrew/anaconda3/lib/python3.12/site-packages (from stack-data->ipython>=6.1.0->ipywidgets==8.*->jupyter-bokeh<5.0.0,>=4.0.5->nucleus-cdk==0.5.0rc2) (0.2.2)
from cdk.analysis.cytosol import platereader as pr
import matplotlib.pyplot as plt
import seaborn as sns
import warnings

# Filter warnings
warnings.filterwarnings('ignore')

# Initialize plotting
pr.plot_setup()
Load the data
Provide a CSV file containing the data, and a platemap. This function returns both the data with the plate map mapped to it, and the platemap by itself, which is useful for certain tasks.
data, platemap = pr.load_platereader_data("./data/20250612-cytation3-pure-timecourse-gfp-ppk-biotek-cdk.txt", "20250612-PPK.csv")

# Well A23 (CP + PolyP + 8 mM Mg, replicate 3/3) fits to k~=0 (degenerate/non-responding), which crashes kinetic_analysis's lag-time calculation. Drop it; keep A19/A21 (its two other replicates).
data_drop = data[data["Well"] != "A23"]
Basic Plots
Kinetics
Kinetic time traces of every well on the plate
pr.plot_plate(data);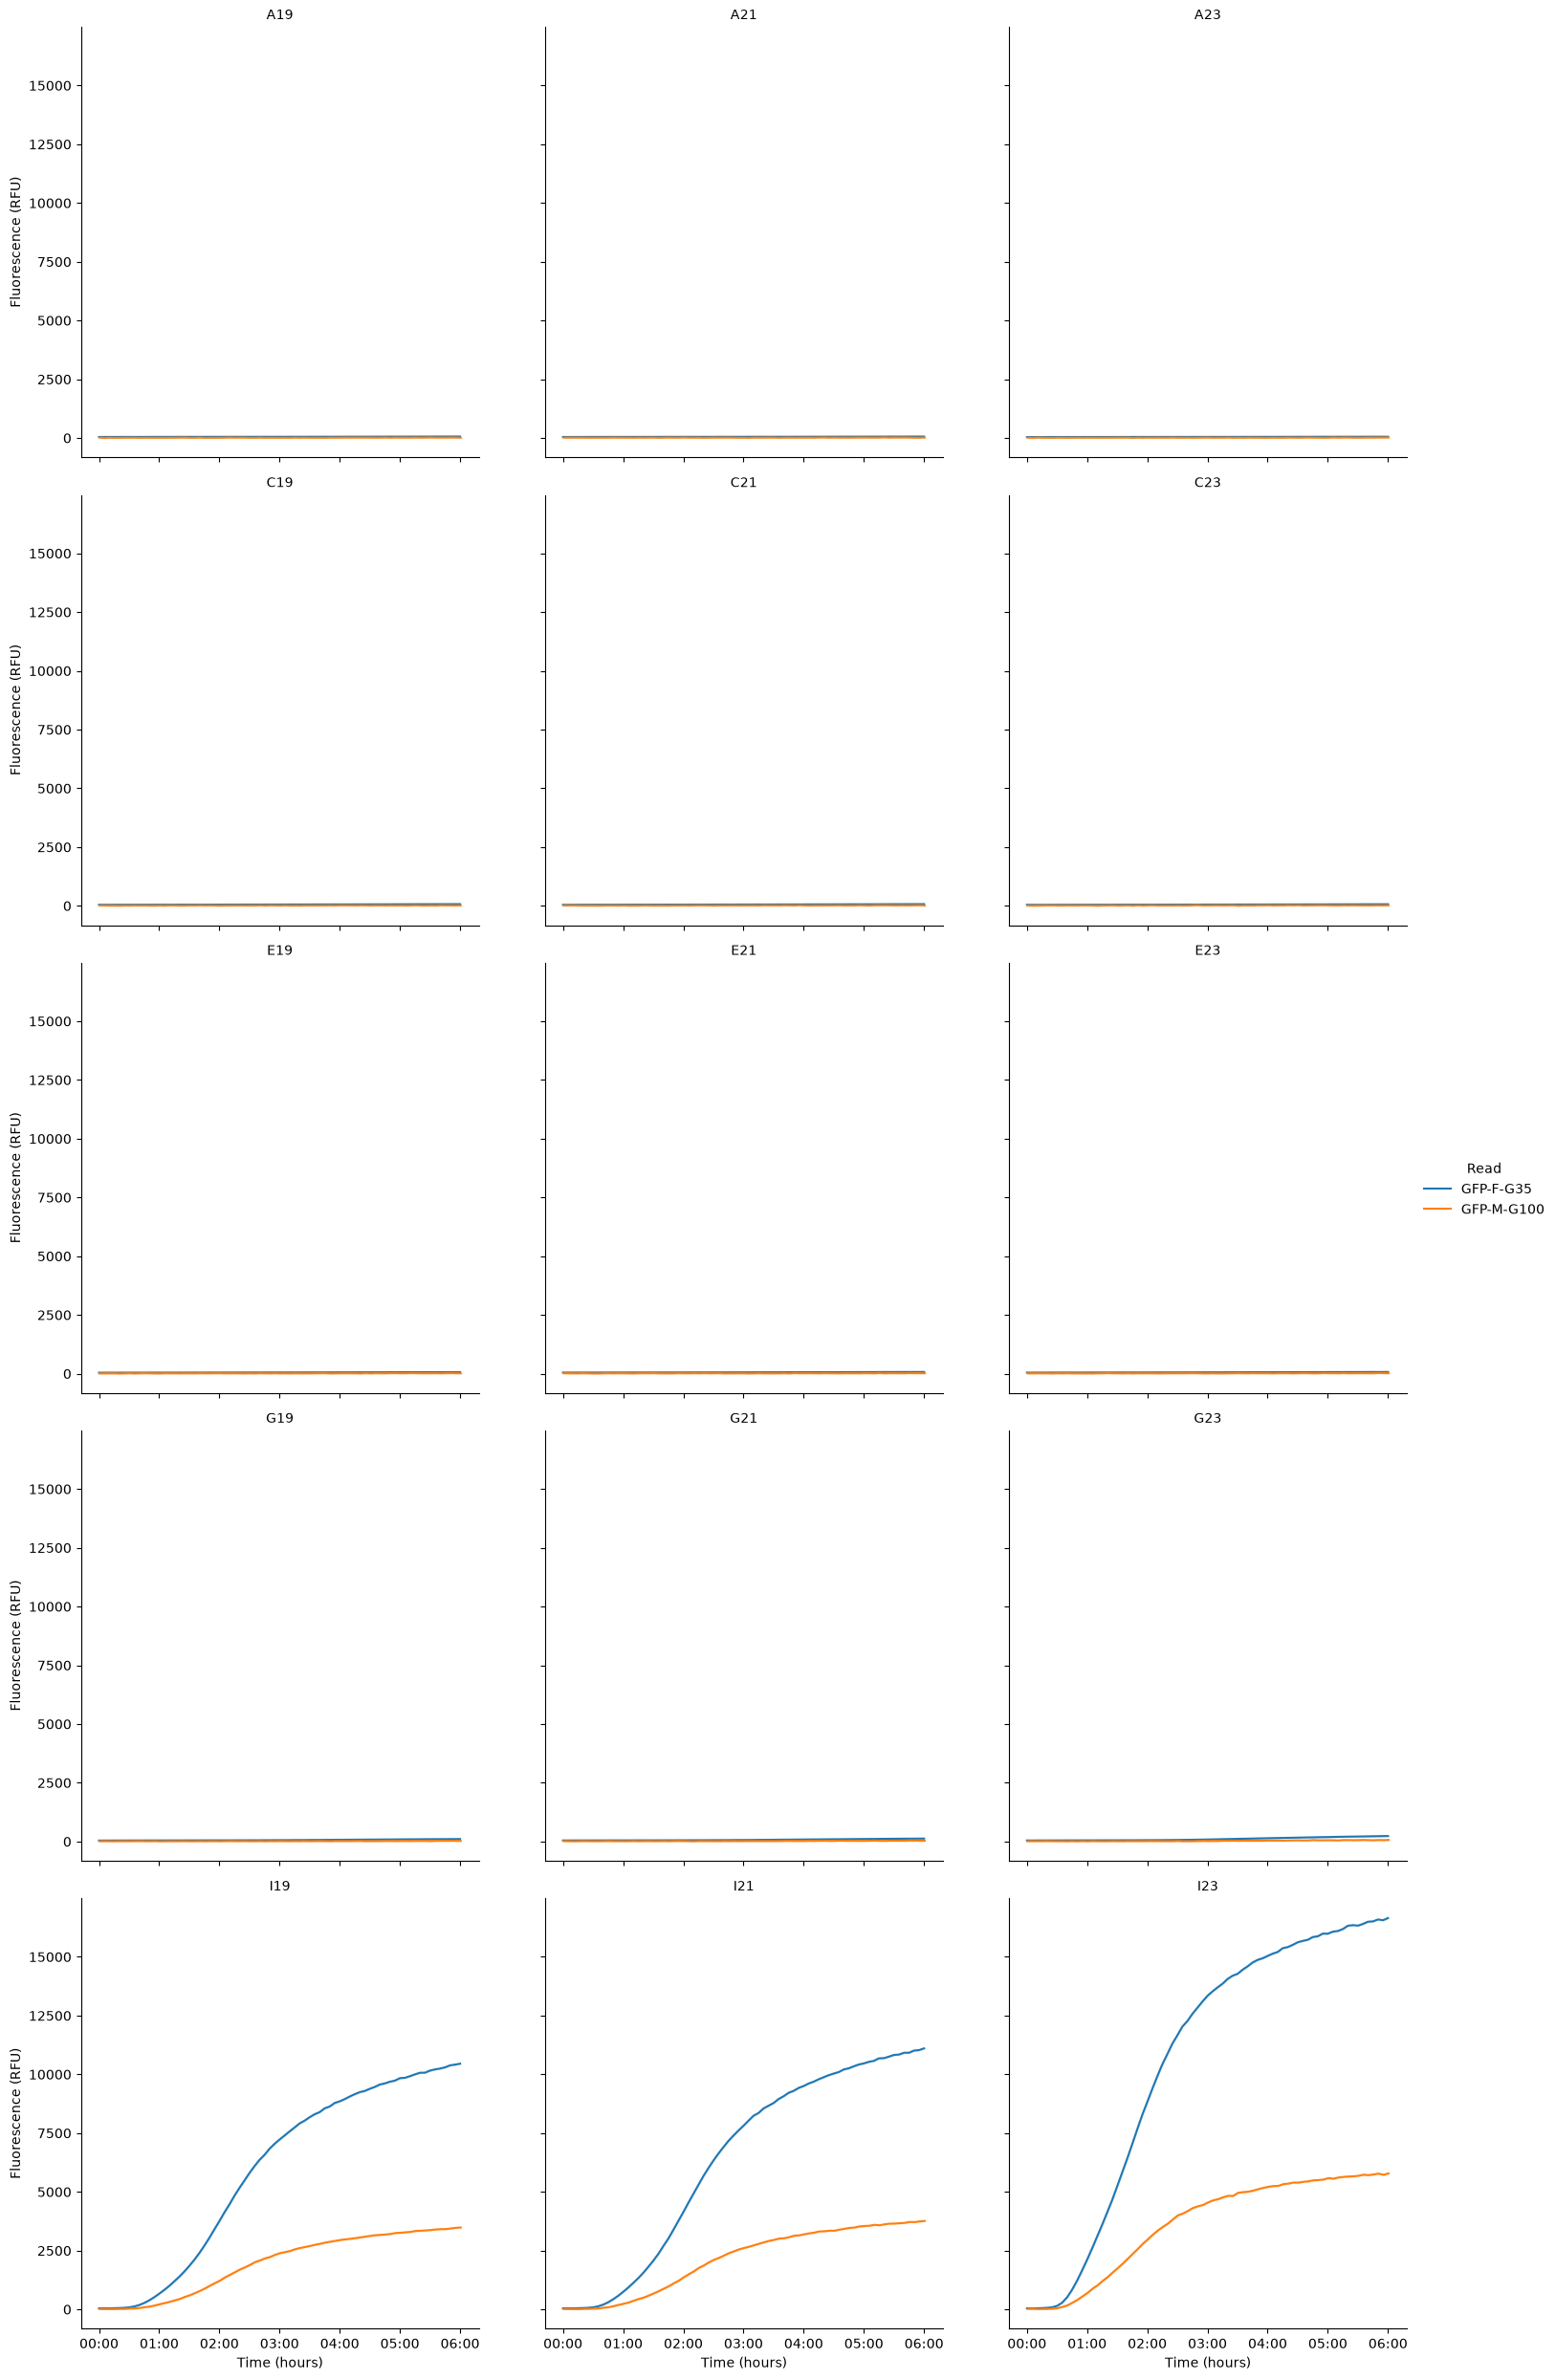
g = pr.plot_curves(data[data["Read"]=="GFP-F-G35"], units="Well", estimator=None, height=12)
g.savefig("plot4")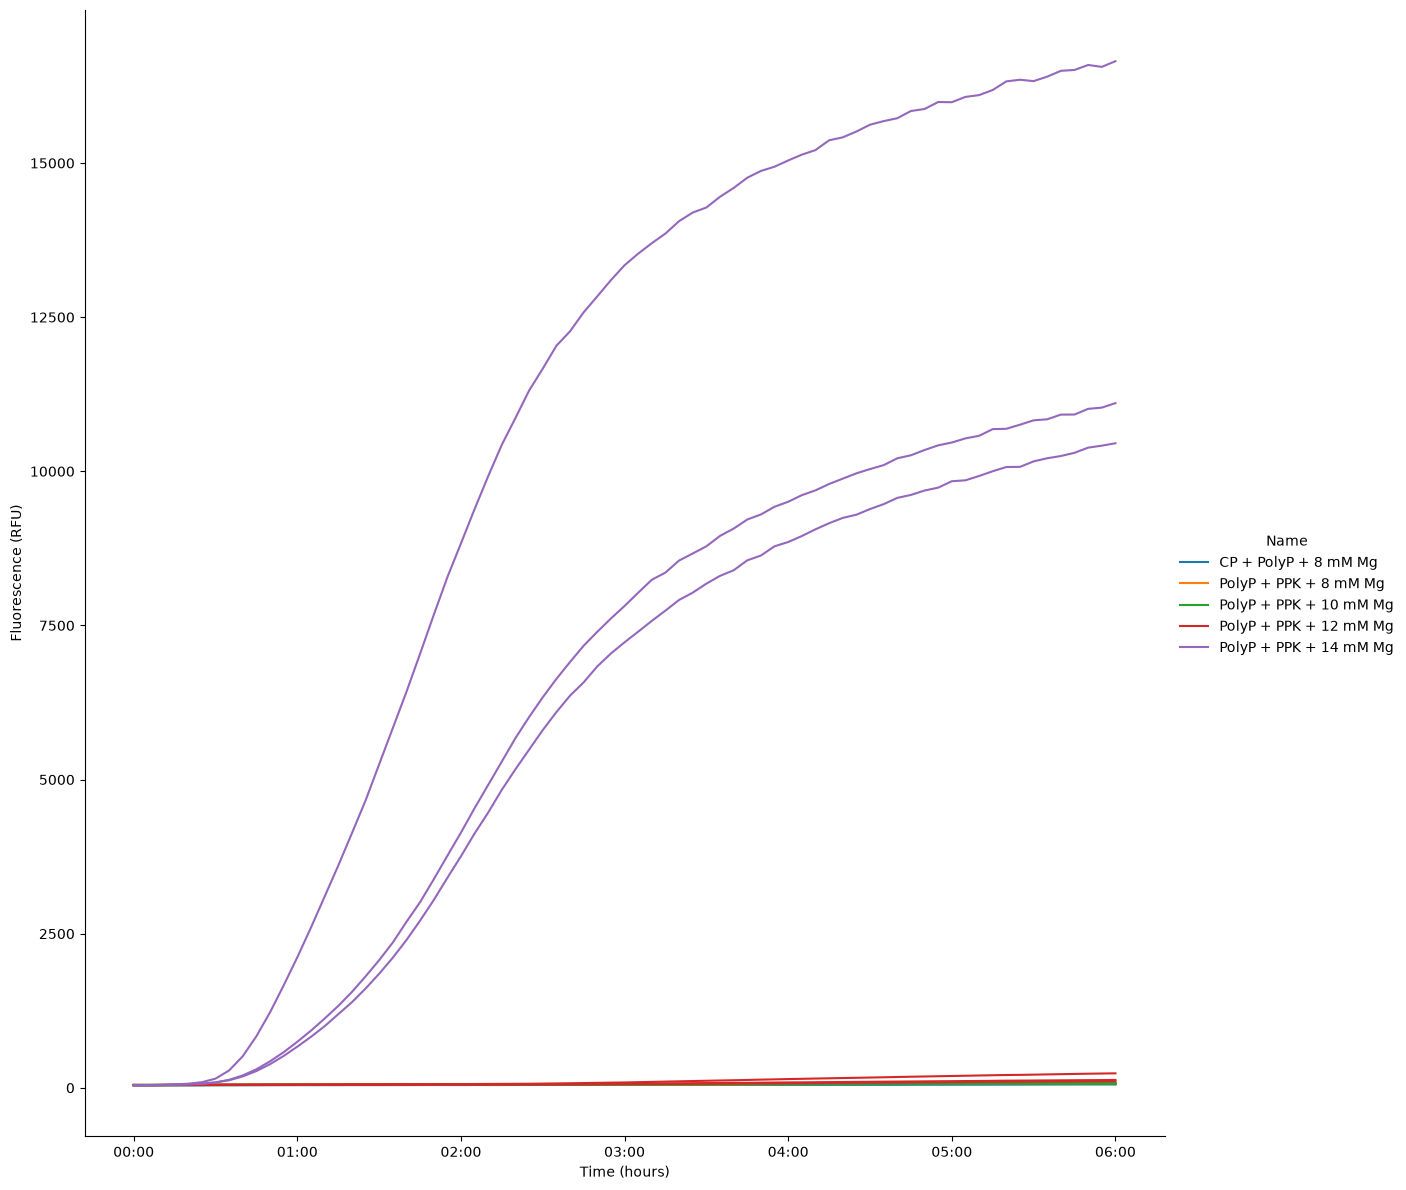
Steady state
Bar graph of steady-state endpoint of each sample. Steady state is calculated as the maximum fluorescence value over a 3-sample rolling average on the data.
ss = pr.find_steady_state(data_drop[data_drop["Read"]=="GFP-F-G35"], group_by=["Well", "Read"]).reset_index()
ss.columns = [c[0] if c[1] == "" else "_".join(c).strip() for c in ss.columns]
steadystate = data_drop.merge(ss[["Well", "Data_steadystate"]], on="Well", how="left")
steadystate.loc[steadystate["Column"]==13, "Column"] = 14
sns.barplot(data=steadystate, x="Name", y="Data_steadystate", hue="Column")
<Axes: xlabel='Name', ylabel='Data_steadystate'>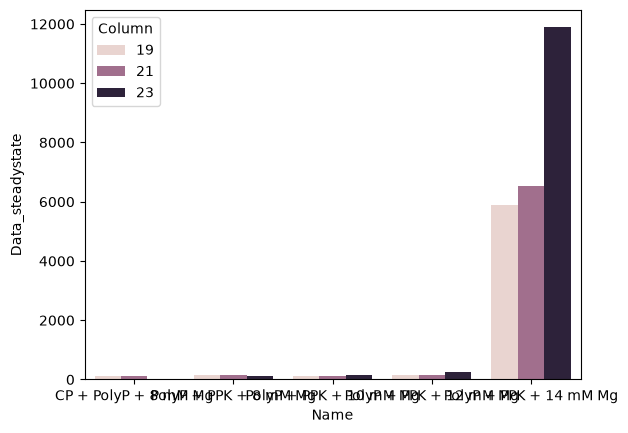
ss= pr.plot_steadystate(data_drop[data_drop["Read"]=="GFP-F-G35"])
plt.xlabel('Condition')
ss.savefig("plot5")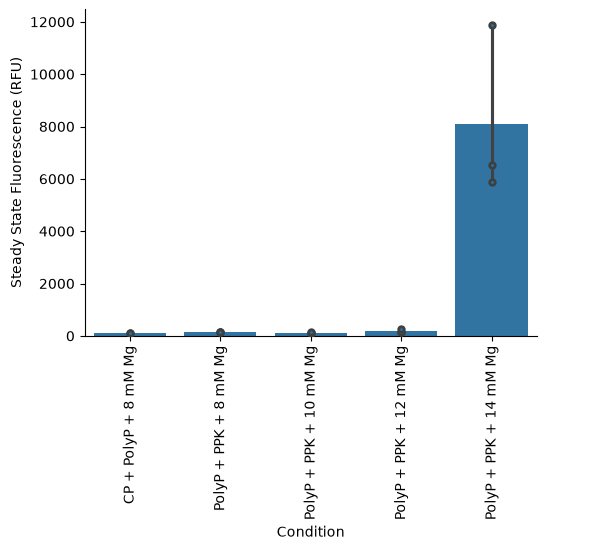
Kinetics Analysis
These functions calculate key kinetic parameters of the time series.
pr.plot_kinetics(data_drop[data_drop["Read"] == "GFP-F-G35"])PROVIDING AVERAGED KINETICS
(<seaborn.axisgrid.FacetGrid at 0x313d29d10>,
                                                   Velocity                  \
                                                       Time    Data     Max
 Name                   Read
 CP + PolyP + 8 mM Mg   GFP-F-G35 0 days 00:31:47.660537468   61.11    0.01
 PolyP + PPK + 10 mM Mg GFP-F-G35 0 days 04:00:52.708004714   67.14    5.22
 PolyP + PPK + 12 mM Mg GFP-F-G35 0 days 04:30:17.546196339  101.75   38.93
 PolyP + PPK + 14 mM Mg GFP-F-G35 0 days 02:01:24.172850169 4264.55 4639.04
 PolyP + PPK + 8 mM Mg  GFP-F-G35 0 days 05:56:29.344611142   71.35    6.96

                                                            Lag            \
                                                           Time      Data
 Name                   Read
 CP + PolyP + 8 mM Mg   GFP-F-G35 -268 days +14:55:51.859371432 -18940.22
 PolyP + PPK + 10 mM Mg GFP-F-G35 -205 days +22:12:19.090164718 -21419.32
 PolyP + PPK + 12 mM Mg GFP-F-G35     0 days 01:36:54.952399330     53.30
 PolyP + PPK + 14 mM Mg GFP-F-G35     0 days 01:06:41.008800030   1374.06
 PolyP + PPK + 8 mM Mg  GFP-F-G35   -1 days +18:50:55.170717205     30.84

                                                 Steady State          \
                                                         Time    Data
 Name                   Read
 CP + PolyP + 8 mM Mg   GFP-F-G35 393 days 16:38:38.345788248  116.11
 PolyP + PPK + 10 mM Mg GFP-F-G35 300 days 20:33:13.979383908  127.57
 PolyP + PPK + 12 mM Mg GFP-F-G35   0 days 08:45:32.447526011  193.32
 PolyP + PPK + 14 mM Mg GFP-F-G35   0 days 03:21:57.710951542 8102.65
 PolyP + PPK + 8 mM Mg  GFP-F-G35   0 days 22:16:21.213717994  135.57

                                                                                 Fit  \
                                                                              params
 Name                   Read
 CP + PolyP + 8 mM Mg   GFP-F-G35  [122.21936476883573, 0.00038979592083930614, 0...
 PolyP + PPK + 10 mM Mg GFP-F-G35  [134.28090880781153, 0.16101818838130802, 4.01...
 PolyP + PPK + 12 mM Mg GFP-F-G35  [203.49400894828668, 0.7265211099597605, 4.504...
 PolyP + PPK + 14 mM Mg GFP-F-G35  [8529.103156762523, 2.194557340674605, 2.02338...
 PolyP + PPK + 8 mM Mg  GFP-F-G35  [142.70146119951525, 0.19505479621203933, 5.94...


                                   R^2  drift
 Name                   Read
 CP + PolyP + 8 mM Mg   GFP-F-G35 0.98   2.93
 PolyP + PPK + 10 mM Mg GFP-F-G35 1.00  -0.52
 PolyP + PPK + 12 mM Mg GFP-F-G35 1.00  -6.66
 PolyP + PPK + 14 mM Mg GFP-F-G35 1.00 808.15
 PolyP + PPK + 8 mM Mg  GFP-F-G35 0.99  -1.68  )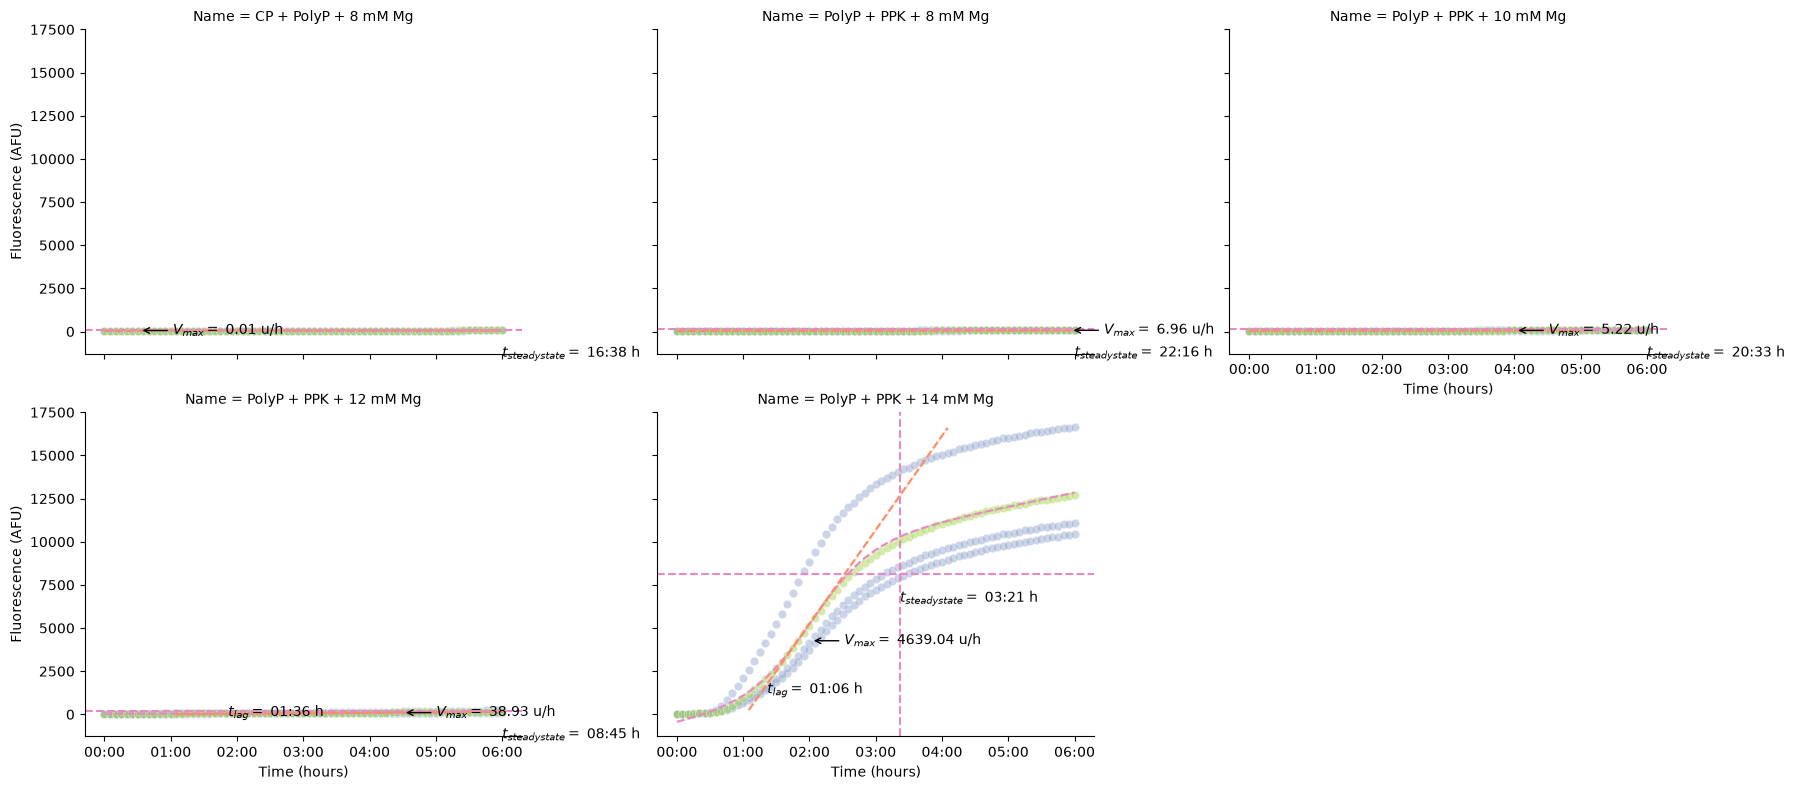
We can also calculate the kinetics and display the parameters as a table.
pr.kinetic_analysis(data_drop)Loading...