

Overview
Toehold exchange (THE) riboregulators are a class of RNA molecules that us toehold-mediated strand exchange (TMSE -- Zhang & Winfree (2009)) to regulate protein translation (Piorino et al. (2025), Schaffter et al. (2025)). In TMSE reactions an input RNA strand binds to an RNA duplex (gate) via a short toehold domain and, through sequence complementarity, initiates a process of branch migration that ultimately can displace an output RNA strand from the double stranded gate duplex. In the case of a THE riboregulator, the release of the output RNA results in exposure of a ribosome binding sequence (rbs) that connects RNA strand exchange to protein expression. THE riboregulators are a subset of a broader class of circuits, termed ctRSD circuits (Schaffter & Strychalski (2022), Schaffter et al. (2023), Bae et al. (2020)), that use self-cleaving ribozymes to cotranscriptionally produce the double-strand RNA gates needed for TMSE reactions. ctRSD circuits can be programmed to execute logic, signal amplification, and signaling cascades.
The mechanism of TMSE offers many design parameters for precisely tuning the strength of protein expression. In Figure 1 we emphasize methods that rely on design changes to the short input RNA rather than changes to the gate that contains the long protein coding sequence. In addition to transcriptional control of expression strength by changing DNA template concentrations (Figure 1, left), protein expression strength can be controlled at the translational level by varying the length of an unstructured domain at the 5’ end of the input strand (d domain). This unstructured domain serves as a standby site for the ribosome to bind to facilitate translation initiation after strand exchange (Karolchik et al. (2013)), with increasing lengths increasing translation strength (Figure 1, right). Lengths beyond 20 bases are not predicted to provide additional benefit (Karolchik et al. (2013)). Because the toehold exchange mechanism is reversible (Zhang & Winfree (2009)), protein expression can also be controlled by modulating the strength of the forward or reverse strand exchange reactions. Increasing the degree of complementarity between the input toehold of the input and gate (s’ domain) increases the rate of production of gate in the ON state. Conversely, increasing the degree of complementarity between the output toehold of the gate and input (e domain) decreases the rate of production of gate in the ON state. Both mechanisms thus tune protein expression strength at the post-transcriptional level (Figure 1, middle).
Together these results illustrate three distinct mechanisms for tuning protein expression with THE riboregulators:
Modulating the concentration of reactants (transcriptional control)
Modulating the rate and extent of reaction to produce products (post-transcriptional control)
Modulating the translation rate of the products (translational control)
Here we present the sequences and protocols for translational control experiments (modulating the length of the d domain on the input strand).
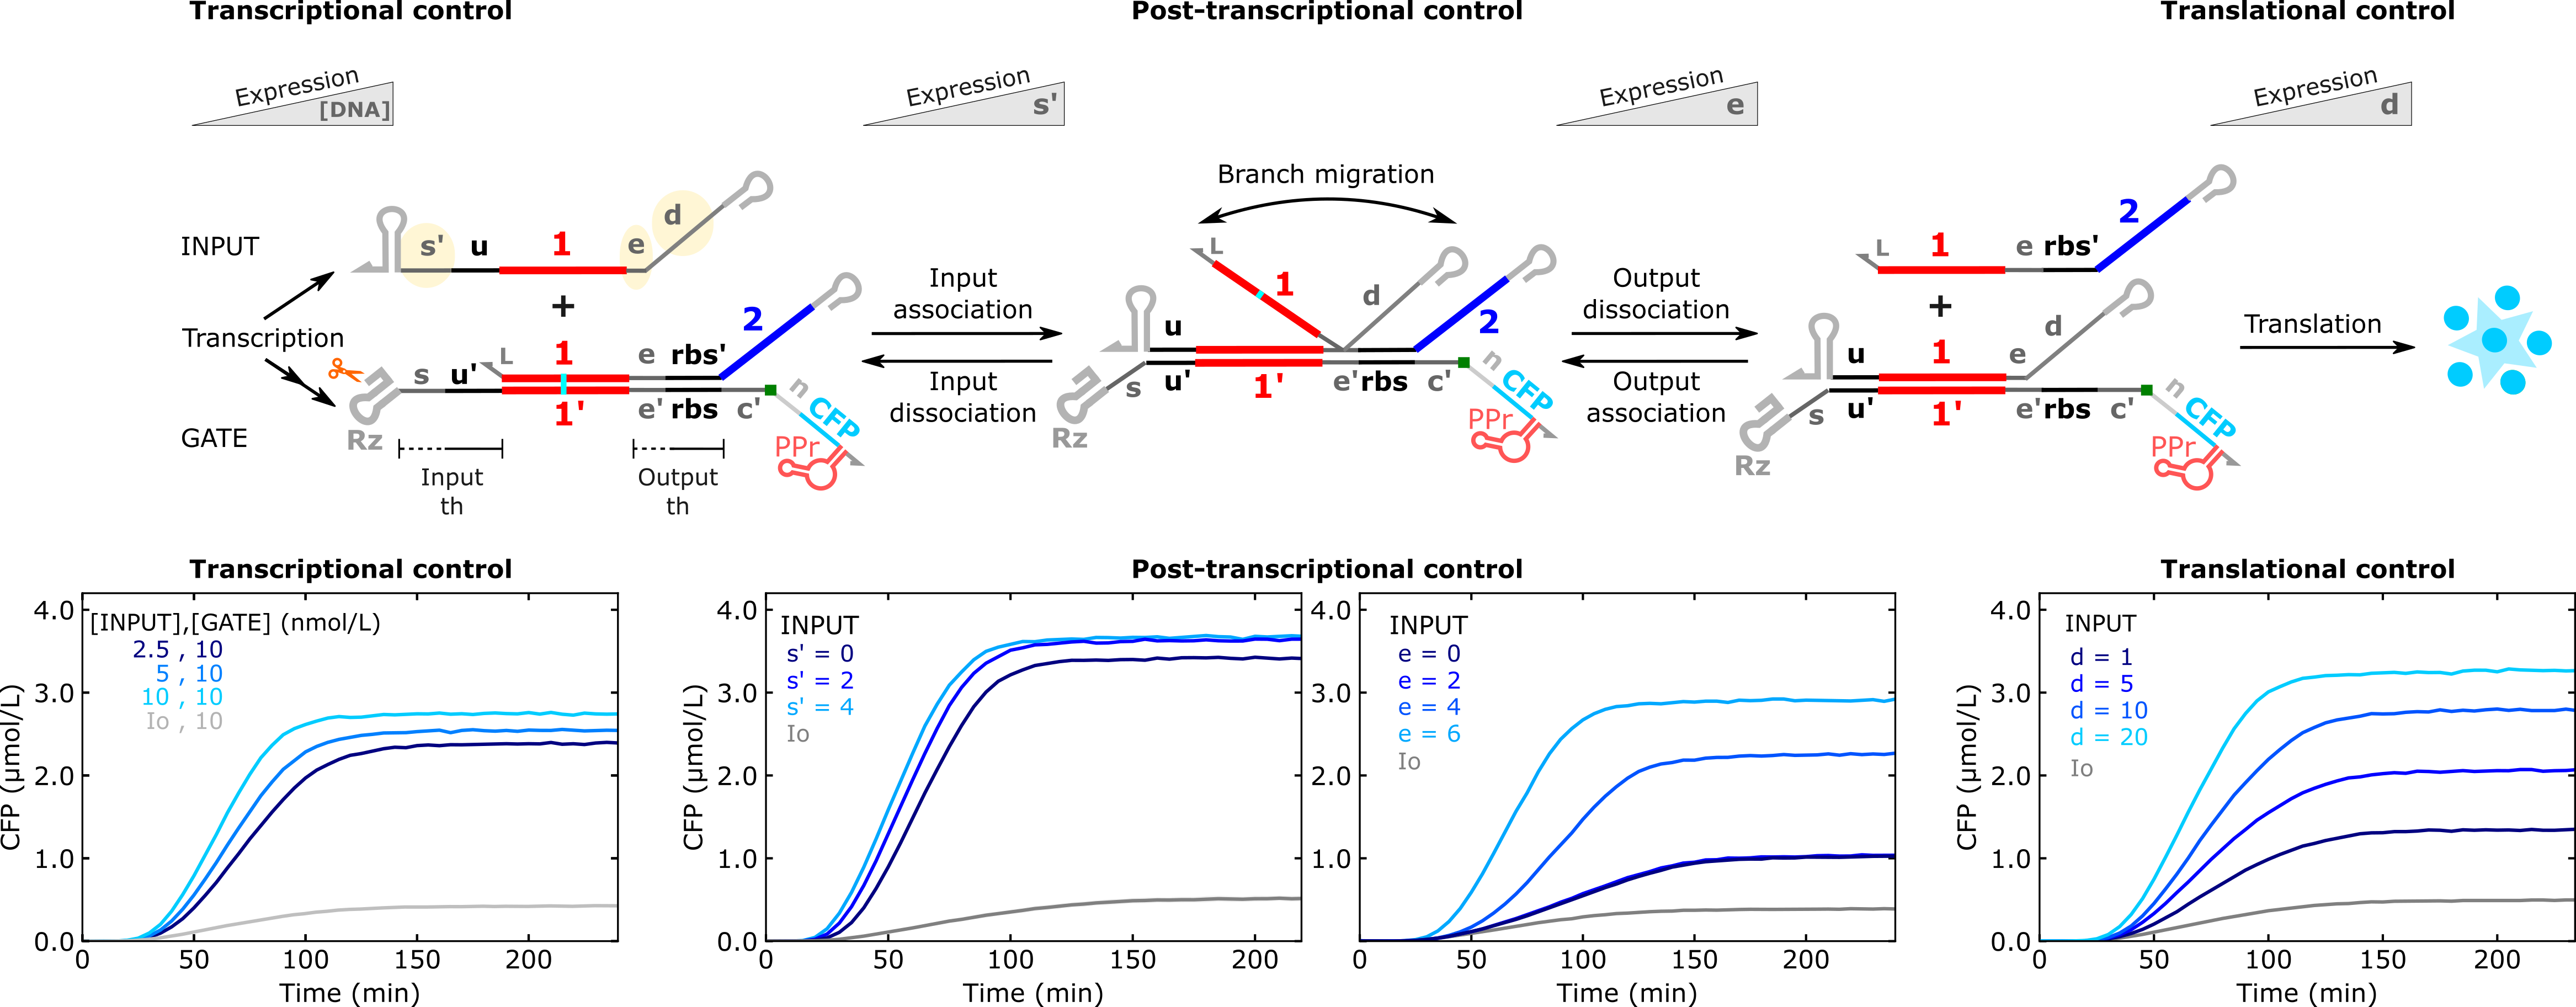
Figure 1:Figure 1: Kinetic data of THE riboregulator operation in PURExpress with plasmid DNA templates. The yellow highlighted domains on the input RNA specify domains that can be modified to control protein expression strength. The Rz domain on the gate indicates the self-cleaving ribozyme necessary to cotranscriptionally produce the double strand RNA duplex needed for TMSE. For transcriptional control results INPUT and GATE template concentrations are listed in the plot. In the remain results both templates were at 5 nmol/L. Legends indicate the length (in bases) of s’, e, or d domains on the input RNA. Other than the translational control results, the d domain was 20 bases. Data from Piorino et al. (2025). See Supplementary Section 1 in Piorino et al. (2025) for a detailed description of component and domain nomenclature.
Design
For a detailed description of THE riboregulator design see Supplementary Section 2 of Schaffter et al. (2025). Supplementary Section S2 of Schaffter & Strychalski (2022) describes the design choices for the broader class of ctRSD gates.
Below we summarize a few design considerations of particular note:
THE riboregulators are currently designed with an 18-base linker sequence (n domain) upstream of the protein coding sequence (CDS) that adds 6 amino acids N terminus of the protein.
There is a start codon at beginning of the n linker domain for translation initiation; the start codon in native protein sequence is changed to a leucine codon (TTA) to minimize the chance for spurious initiation from gates in the OFF state.
Not all design trends in PURE produce the same results in cells or in cell lysate, notably the post-transcriptional control mechanisms (see Piorino et al. (2025) and Schaffter et al. (2025)).
To design alternative sequences, see Resources below for sequence compiling software to create new combinations of domains.
Annotated plasmid maps can be found on Benchling: Link
Materials and Equipment
Key Materials
Table 1:Non-nucleic acid materials.
| Name | Product | Manufacturer | Part # | Price | Link | Storage |
|---|---|---|---|---|---|---|
| PURExpress | NEB PURExpress in vitro protein synthesis kit | New England Biolabs | E6800S | $307.00 | link | -80 °C |
| HBC620 Pepper dye | HBC620 | MedChemExpress | HY-133520 | — | — | — |
| DMSO | Dimethyl Sulfoxide | Fisher BioReagents | BP231-100 | $84.70 | link | Room temp (flammable) |
| 5x txn buffer | T7 RNA polymerase | ThermoFisher Scientific | EP0111 | $109.00 | link | -20 °C |
| 384-well plates* | Microplate, 384 well, PS, F-bottom | Greiner Bio-one | 784101 | $408.20 | link | Room temp |
| Nuclease free water | Nuclease free water (not DEPC treated) | ThermoFisher Scientific | AM9939 | $162.00 | link | Room temp |
| 200 µL PCR tubes | TempAssure PCR Flex-Free 8-Tube Strips, Attached Individual Optical Caps | USA Scientific | 1402-4700 | $96.75 | link | Room temp |
| 2x PCR Master Mix | Phusion Flash High-Fidelity PCR Master Mix | ThermoFisher Scientific | F548S | $110.65 | link | -20 °C |
| PureLink cleanup kit | PureLink PCR Purification Kit | ThermoFisher Scientific | K310001 | $148.00 | link | Room temp |
* Most 384-well plates should work but check the minimum volume recommended by the manufacturer and scale the reactions up accordingly if the minimum volume is > 10 µL.
DNA Components
Table 2:Nucleic acid primers and molecular beacon oligonucleotides, typically ordered from Integrated DNA Technologies (IDT). Base modifications follow IDT’s nomenclature. An ‘m’ preceding a base indicates a 2’-O-methyl modification. The quencher modified strand of the reporter should be ordered with HPLC purification. All other strands can be ordered with standard desalting.
| Name | Sequence | Purpose |
|---|---|---|
| T7fwd | TTCTAATACGACTCACTATAGGGAG | fwd primer for T7 promoter |
| T7rev | CAAAAAACCCCTCAAGACCCGTTTAG | rev primer for T7t terminator |
| Thyb10rev | AAAAAAAAACAGATAGCCGCGCGAAC | rev primer for Thyb10 terminator |
| R{x2}-F-2omR | /5HEX/mCmUmAmCmAmUmCmCmAmCmAmUmAmCmUmA | 2omRNA-based fluorophore strand of molecular beacon, can be used with any quencher strand below |
| R{rbs2}-Q-2omR | mAmGmGmAmGmGmUmAmGmUmAmUmGmUmGmGmAmUmGmUmAmG/3IAbRQSp/ | 2omRNA-based quencher strand of molecular beacon with rbs toehold |
| MB rbs trigger 2omR | mCmUmAmCmAmUmCmCmAmCmAmUmAmCmUmAmCmCmUmCmCmU | 2omRNA-based trigger strand for spiking molecular beacon signal, rbs toehold |
Table 3:DNA templates for ctRSD inputs. These sequences can be ordered as linear gene fragments, typically eBlocks or gBlocks from IDT. Full sequences are for eBlock orders (>300 bases). Underlined portions of the sequences represent the transcription unit (promoter to terminator) for ordering as a gBlock (>125 bases). Annotated sequence maps can be found on Benchling.
| Translation strength | Short name | Full name | Sequence |
|---|---|---|---|
| Expression: Min (OFF) | Io | Io | gaagtctaacgctgctctgggctaactgtcCATTACTCGCATCCATTCTCAGGCTGTCTCGTCTCGTCTC TTC TAATACGACTCACTATA GGGAGATTCGTCTCCCAATCAATAACACACATA ataatcAGATAACAGATACttcgGtatctgttatctgttTTTTTTcAACAGATAGCCGCG ttcgCGCGGCtatctgttTTTTTTtagctgtcaccggatgtgctttccggtctgatgagtcc gtgaggacgaaacagcctcCCAGGATACATAGATTACCACAACTCCGAGCCCTTCCACC |
| Expression: Max | IN_1 | I{u1d} [], [d20 Thyb10] | gaagtctaacgctgctctgggctaactgtcCATTACTCGCATCCATTCTCAGGCTGTCTCGTCTCGTCTC TTC TAATACGACTCACTATA GGGAGATTCGTCTCCCAAATACTTAATACAAAATAATCACTTCACAACATCA ataatcAGATAACAGATACttcgGtatctgttatctgttTTTTTTcAACAGATAGCCGCG ttcgCGCGGCtatctgttTTTTTT tagctgtcaccggatgtgctttccggtctgatgagtcc gtgaggacgaaacagcctcCCAGGATACATAGATTACCACAACTCCGAGCCCTTCCACC |
| Expression: Low | IN_2 | I{u1} [], [Thyb10] | gaagtctaacgctgctctgggctaactgtcCATTACTCGCATCCATTCTCAGGCTGTCTCGTCTCGTCTC TTC TAATACGACTCACTATA GGGAGATTCGTCTCCCATCACTTCACAACATCA ataatcAGATAACAGATACttcgGtatctgttatctgttTTTTTTcAACAGATAGCCGCG ttcgCGCGGCtatctgttTTTTTTtagctgtcaccggatgtgctttccggtctgatgagtcc gtgaggacgaaacagcctcCCAGGATACATAGATTACCACAACTCCGAGCCCTTCCACC |
| Expression: Medium | IN_3 | I{u1d} [], [d5 Thyb10] | gaagtctaacgctgctctgggctaactgtcCATTACTCGCATCCATTCTCAGGCTGTCTCGTCTCGTCTC TTC TAATACGACTCACTATA GGGAGATTCGTCTCCCAATAATCACTTCACAACATCA ataatcAGATAACAGATACttcgGtatctgttatctgttTTTTTTcAACAGATAGCCGCG ttcgCGCGGCtatctgttTTTTTTtagctgtcaccggatgtgctttccggtctgatgagtcc gtgaggacgaaacagcctcCCAGGATACATAGATTACCACAACTCCGAGCCCTTCCACC |
| Expression: High | IN_4 | I{u1d} [], [d10 Thyb10] | gaagtctaacgctgctctgggctaactgtcCATTACTCGCATCCATTCTCAGGCTGTCTCGTCTCGTCTC TTC TAATACGACTCACTATA GGGAGATTCGTCTCCCAACAAAATAATCACTTCACAACATCA ataatcAGATAACAGATACttcgGtatctgttatctgttTTTTTTcAACAGATAGCCGCG ttcgCGCGGCtatctgttTTTTTTtagctgtcaccggatgtgctttccggtctgatgagtcc gtgaggacgaaacagcctcCCAGGATACATAGATTACCACAACTCCGAGCCCTTCCACC |
Table 4:DNA templates for full THE riboregulator transcription (TX) unit. Bold sequences indicate promoters. Underlined sequences indicate complementary regions for overlap PCR. Italic sequences indicate terminators. Annotated sequence maps can be found on Benchling.
| Full TX unit | Short name | Full name | Sequence |
|---|---|---|---|
| Full TX unit | G_1 T7t sCFP3A | G{u1,rbs2} [s4u], [], [R3 sCFP3A tDF30PPr T7t] | TTC TAATACGACTCACTATA GGGAGATTCGTCTCCCACTACATCCACATACTACCTCCTTTACTTC ACATTCGGGTCGGCATGGCATGTGCACCTCCTCGCGGTCCGACCTGGGCTACTTCGGTAGGCTAAGGCAC AGTATGATGTTGTGAAGTGAAGGAGGATATAAATGAAACAGAACAAAGAACAGTTAGTCAGTAAAGGTGA AGAATTATTTACCGGTGTTGTACCGATATTAGTCGAACTGGACGGTGACGTAAACGGACATAAGTTCTCT GTAAGTGGAGAAGGTGAAGGGGATGCCACCTACGGGAAATTGACGCTGAAATTTATTTGCACGACAGGGA AACTGCCAGTCCCCTGGCCTACTCTGGTAACCACACTTACGTGGGGGGTTCAGTGCTTTGCACGCTATCC CGACCATATGAAGCAGCACGATTTTTTCAAATCTGCGATGCCGGAGGGCTATGTGCAAGAACGGACCATT TTCTTTAAGGACGATGGTAACTATAAAACTCGCGCCGAAGTTAAATTTGAAGGTGACACTTTGGTCAACC GTATAGAACTGAAGGGGATAGATTTTAAGGAAGATGGTAATATCCTTGGTCACAAGTTGGAATACAACTA CATCAGCGATAATGTATACATCACAGCCGACAAGCAAAAAAACGGTATCAAAGCAAACTTCAAAATACGT CACAACATCGAGGACGGTGGAGTCCAGCTGGCCGACCACTACCAGCAGAACACCCCAATAGGCGACGGAC CTGTTCTTCTGCCAGACAACCACTACCTTTCGACTCAATCAAAGCTTTCAAAGGATCCTAACGAGAAACG GGATCATATGGTGTTGCTTGAGTTCGTTACGGCAGCTGGTATAACCTTGGGGATGGACGAACTTTACAAA TAATAAAAAGCCCGGATAGCTCAGTCGGTAGAGCAGCGGCCGGTTGCCATGTGTATGTGGGCCAATCGTG GCGTGTCGGCCTGCTTCGGCAGGCACTGGCGCCGCCCACATACTCTGATGATCCCCAATCGTAGCGTGTC GGGGTGCGCTTGCACCCACTGGCGCTGGGATCATTCATGGCAACGGCCGCGGGTCCAGGGTTCAAGTCCC TGTTCGGGCGCCActagcataaccccttggggcctctaaacgggtcttgaggggttttttg |
| Full TX unit | G_1 T7t sfGFP | G{u1,rbs2} [s4u], [], [R3 sfGFP tDF30PPr T7t] | TTC TAATACGACTCACTATA GGGAGATTCGTCTCCCACTACATCCACATACTACCTCCTTTACTTC ACATTCGGGTCGGCATGGCATGTGCACCTCCTCGCGGTCCGACCTGGGCTACTTCGGTAGGCTAAGGCAC AGTATGATGTTGTGAAGTGAAGGAGGATATAAATGAAACAGAACAAAGAACAGATGAGCAAAGGTGAAGA ACTGTTTACCGGCGTTGTGCCGATTCTGGTGGAACTGGATGGCGATGTGAACGGTCACAAATTCAGCGTG CGTGGTGAAGGTGAAGGCGATGCCACGATTGGCAAACTGACGCTGAAATTTATCTGCACCACCGGCAAAC TGCCGGTGCCGTGGCCGACGCTGGTGACCACCCTGACCTATGGCGTTCAGTGTTTTAGTCGCTATCCGGA TCACATGAAACGTCACGATTTCTTTAAATCTGCAATGCCGGAAGGCTATGTGCAGGAACGTACGATTAGC TTTAAAGATGATGGCAAATATAAAACGCGCGCCGTTGTGAAATTTGAAGGCGATACCCTGGTGAACCGCA TTGAACTGAAAGGCACGGATTTTAAAGAAGATGGCAATATCCTGGGCCATAAACTGGAATACAACTTTAA TAGCCATAATGTTTATATTACGGCGGATAAACAGAAAAATGGCATCAAAGCGAATTTTACCGTTCGCCAT AACGTTGAAGATGGCAGTGTGCAGCTGGCAGATCATTATCAGCAGAATACCCCGATTGGTGATGGTCCGG TGCTGCTGCCGGATAATCATTATCTGAGCACGCAGACCGTTCTGTCTAAAGATCCGAACGAAAAAGGCAC GCGGGACCACATGGTTCTGCACGAATATGTGAATGCGGCAGGTATTACGTGGAGCCATCCGCAGTTCGAA AAATAATATGCCCGGATAGCTCAGTCGGTAGAGCAGCGGCCGGTTGCCATGTGTATGTGGGCCAATCGTG GCGTGTCGGCCTGCTTCGGCAGGCACTGGCGCCGCCCACATACTCTGATGATCCCCAATCGTAGCGTGTC GGGGTGCGCTTGCACCCACTGGCGCTGGGATCATTCATGGCAACGGCCGCGGGTCCAGGGTTCAAGTCCC TGTTCGGGCGCCActagcataaccccttggggcctctaaacgggtcttgaggggttttttg |
Table 5:DNA templates for assembling THE riboregulators with overlap PCR. Bold sequences indicate promoters. Underlined sequences indicate complementary regions for overlap PCR. Italic sequences indicate terminators. Annotated sequence maps can be found on Benchling.
| Component | Short name | Full name | Sequence |
|---|---|---|---|
| 5’ UTR | G_1 | G{u1,rbs2} [s4u], [], [R3] | ataggagccgcgaagtctaacgctgctctgggctaactgtccgcatctagacttaactgagatattacca tagatgactagccattcctctagatactacgactagcatacTTCTAATACGACTCACTATAGGGAG ATTCGTCTCCCACTACATCCACATACTACCTCCTTTACTTCACATTCGGGTCGGCATGGCATGTGCACCT CCTCGCGGTCCGACCTGGGCTACTTCGGTAGGCTAAGGCACAGTATGATGTTGTGAAGTGAAGGAGGATA TAAATGAAACAGAACAAAGAACAG |
| sCFP3A-PPr CDS | sCFP3A | sCFP3A tDF30PPr | ATATAAATGAAACAGAACAAAGAACAGTTAGTCAGTAAAGGTGAAGAATTATTTACCGGTGTTGTACCGA TATTAGTCGAACTGGACGGTGACGTAAACGGACATAAGTTCTCTGTAAGTGGAGAAGGTGAAGGGGATGC CACCTACGGGAAATTGACGCTGAAATTTATTTGCACGACAGGGAAACTGCCAGTCCCCTGGCCTACTCTG GTAACCACACTTACGTGGGGGGTTCAGTGCTTTGCACGCTATCCCGACCATATGAAGCAGCACGATTTTT TCAAATCTGCGATGCCGGAGGGCTATGTGCAAGAACGGACCATTTTCTTTAAGGACGATGGTAACTATAA AACTCGCGCCGAAGTTAAATTTGAAGGTGACACTTTGGTCAACCGTATAGAACTGAAGGGGATAGATTTT AAGGAAGATGGTAATATCCTTGGTCACAAGTTGGAATACAACTACATCAGCGATAATGTATACATCACAG CCGACAAGCAAAAAAACGGTATCAAAGCAAACTTCAAAATACGTCACAACATCGAGGACGGTGGAGTCCA GCTGGCCGACCACTACCAGCAGAACACCCCAATAGGCGACGGACCTGTTCTTCTGCCAGACAACCACTAC CTTTCGACTCAATCAAAGCTTTCAAAGGATCCTAACGAGAAACGGGATCATATGGTGTTGCTTGAGTTCG TTACGGCAGCTGGTATAACCTTGGGGATGGACGAACTTTACAAATAATAAAAAGCCCGGATAGCTCAGTC GGTAGAGCAGCGGCCGGTTGCCATGTGTATGTGGGCCAATCGTGGCGTGTCGGCCTGCTTCGGCAGGCAC TGGCGCCGCCCACATACTCTGATGATCCCCAATCGTAGCGTGTCGGGGTGCGCTTGCACCCACTGGCGCT GGGATCATTCATGGCAACGGCCGCGGGTCCAGGGTTCAAGTCCCTGTTCGGGCGCCActagcataaccc cttggggcctctaaacgggtcttgaggggttttttg |
| sfGFP-PPr CDS | sfGFP | sfGFP tDF30PPr | ATATAAATGAAACAGAACAAAGAACAGATGAGCAAAGGTGAAGAACTGTTTACCGGCGTTGTGCCGATTC TGGTGGAACTGGATGGCGATGTGAACGGTCACAAATTCAGCGTGCGTGGTGAAGGTGAAGGCGATGCCAC GATTGGCAAACTGACGCTGAAATTTATCTGCACCACCGGCAAACTGCCGGTGCCGTGGCCGACGCTGGTG ACCACCCTGACCTATGGCGTTCAGTGTTTTAGTCGCTATCCGGATCACATGAAACGTCACGATTTCTTTA AATCTGCAATGCCGGAAGGCTATGTGCAGGAACGTACGATTAGCTTTAAAGATGATGGCAAATATAAAAC GCGCGCCGTTGTGAAATTTGAAGGCGATACCCTGGTGAACCGCATTGAACTGAAAGGCACGGATTTTAAA GAAGATGGCAATATCCTGGGCCATAAACTGGAATACAACTTTAATAGCCATAATGTTTATATTACGGCGG ATAAACAGAAAAATGGCATCAAAGCGAATTTTACCGTTCGCCATAACGTTGAAGATGGCAGTGTGCAGCT GGCAGATCATTATCAGCAGAATACCCCGATTGGTGATGGTCCGGTGCTGCTGCCGGATAATCATTATCTG AGCACGCAGACCGTTCTGTCTAAAGATCCGAACGAAAAAGGCACGCGGGACCACATGGTTCTGCACGAAT ATGTGAATGCGGCAGGTATTACGTGGAGCCATCCGCAGTTCGAAAAATAATATGCCCGGATAGCTCAGTC GGTAGAGCAGCGGCCGGTTGCCATGTGTATGTGGGCCAATCGTGGCGTGTCGGCCTGCTTCGGCAGGCAC TGGCGCCGCCCACATACTCTGATGATCCCCAATCGTAGCGTGTCGGGGTGCGCTTGCACCCACTGGCGCT GGGATCATTCATGGCAACGGCCGCGGGTCCAGGGTTCAAGTCCCTGTTCGGGCGCCActagcataaccc cttggggcctctaaacgggtcttgaggggttttttg |
Protocol
Preparation of HBC620 Pepper dye stock solution
The HBC620 dye is not necessary to assess THE riboregulator performance, but it does provide a measurement of transcription rate in an experiment. It should only be included if the RNA component you are testing encodes for the Pepper RNA aptamer, otherwise no signal will be produced.
Centrifuge the tube containing lyophilized HBC620 dye to ensure all the dye is at the bottom of the tube.
In a chemical fume hood, prepare a 10 mM stock solution by adding 100 % DMSO to the HBC620 dye tube (273.6 µL DMSO per 1 mg of HBC620 dye).
Vortex thoroughly until dye is dissolved.
Wrap tube in aluminum foil to prevent photobleaching.
Store at -20 °C when not in use.
Preparation of the molecular beacon (optional)
The molecular beacon is not strictly necessary to assess THE riboregulator performance, but it does provide a complementary measurement to fluorescent protein expression for strand exchange and can provide mechanistic insight. It is useful to include in experiments in which translation is absent or inhibited, such as experiments in PURE lacking ribosomes or elongation factors, as this enables measurement of strand exchange without fluorescent protein production.
Table 6:Molecular beacon solution.
| Component | Volume |
|---|---|
| Nuclease free water | 40 µL |
| 5x txn buffer | 20 µL |
| 100 µM R{x2}-F-2omR | 20 µL |
| 100 µM R{rbs2}-Q-2omR | 20 µL |
Table 7:Molecular beacon thermal annealing protocol.
| Step | Temperature | Time | Iterations |
|---|---|---|---|
| Initial denaturation | 90 °C | 5 min | 1 |
| 90 °C to 80 °C ramp | -1 °C/min | 1 min | 9 |
| 80 °C to 70 °C ramp | -1 °C/min | 1 min | 9 |
| 70 °C to 60 °C ramp | -1 °C/min | 1 min | 9 |
| 60 °C to 50 °C ramp | -1 °C/min | 1 min | 9 |
| 50 °C to 40 °C ramp | -1 °C/min | 1 min | 9 |
| 40 °C to 30 °C ramp | -1 °C/min | 1 min | 9 |
| 30 °C to 20 °C ramp | -1 °C/min | 1 min | 9 |
| Hold | 4 °C | Hold | 1 |
Centrifuge tubes containing lyophilized DNA to ensure all the DNA is at the bottom of the tube.
Using nuclease free water, resuspend lyophilized DNA to 100 µM concentration (10 µL of water per 1 nmol of DNA).
Vortex thoroughly until DNA is dissolved.
In a 200 µL PCR tube, prepare 20 µM molecular beacon solution for thermal annealing (Table 6).
In a thermocycler, run the following thermal annealing protocol (Table 7).
Store annealed molecular beacon at -20 °C when not in use.
Preparation of linear DNA templates
Linear PCR product templates are recommended as they are simpler to work with and less prone to variability from preparation-to-preparation compared to plasmid extractions. We also find that linear PCR product templates produce higher fluorescent signals in PURE than plasmid templates.
Gene fragments containing full transcription units (spanning a promoter sequence to terminator sequence) can be ordered (Table 3 and Table 4) and PCR amplified as shown in Table 8. Alternatively, for THE riboregulator gates, a single gene fragment spanning the N-terminal linker sequence to the terminator sequence of the gate can be ordered and the 5’ UTR and promoter of the gate can be ordered separately and appended with overlap PCR (Table 5). This reduces cost and increases flexibility as multiple short 5’ UTR sequences can be ordered and appended to the single protein coding sequence. Table 9 shows how to set up the overlap extension PCR.
Prepare DNA templates:
a. If ordering DNA as gBlock gene fragments, resuspend DNA to 10 ng/µL in nuclease free water.
b. If ordering DNA as eBlock gene fragments, the DNA will come at 10 ng/µL in IDTE buffer and can be used directly.
Prepare DNA primers:
a. Centrifuge tubes containing lyophilized DNA to ensure all the DNA is at the bottom of the tube.
b. Using nuclease free water, resuspend lyophilized DNA to 100 µM concentration (10 µL of water per 1 nmol of DNA).
c. Vortex thoroughly until DNA is dissolved.
In a 200 µL PCR tube prepare PCR solution (Table 8 or Table 9).
In a thermocycler, run the following protocol (Table 10). The same protocol can be used for single template PCR or overlap extension PCR.
Purify the PCR products from the reactions with the PureLink PCR cleanup kit.
a. Add 300 µL of B2 buffer to PureLink column.
b. Add all 75 µL of PCR reaction the PureLink column and pipette mix with B2 buffer ~10 times.
c. Centrifuge PureLink column at 13000 rpm for 1 min, discard flow through.
d. For overlap PCR products, a 300 µL wash with B3 buffer is recommended to remove short secondary products. DO NOT DO THIS FOR SHORT TEMPLATES THAT ENCODE INPUT RNAS or a lot of DNA will be lost.
i. Add 300 µL of B3 buffer and repeat step c.
e. Add 650 µL Wash buffer to PureLink column and repeat step c.
f. Repeat step c. one more time to remove any residual Wash buffer.
g. Add 35 µL of PureLink Elution buffer and let the column sit at room temperature for ~2 min.
h. Move PureLink column to a fresh collection tube and centrifuge at 13000 rpm for 1 min.
i. Save collection tube with eluted DNA.
Measure the concentration of the purified PCR product using A260 absorbance measurements (Nanodrop) or fluorogenic measurements (Qubit).
a. For PCR products we find these two measurements are fairly similar. Qubit measurements were used in our published work.
Purified PCR products can be stored at -20 °C when not in use.
| Component | Volume |
|---|---|
| Nuclease free water | 36.6 µL |
| 2x PCR master mix | 37.5 µL |
| 100 µM T7fwd primer | 0.375 µL |
| 100 µM T7rev primer | 0.375 µL |
| 10 ng/uL 5UTR template | 0.15 µL |
| 10 ng/uL CDS template | 0.45 µL |
Table 10:Molecular beacon thermal annealing protocol.
| Step | Temperature | Time | Iterations |
|---|---|---|---|
| Initial denaturation | 98 °C | 5 min | 1 |
| Denaturation | 98 °C | 30 s | 30 |
| Annealing | 60 °C | 30 s | 30 |
| Extension | 72 °C | 30 s | 30 |
| Final extension | 72 °C | 3 min | 1 |
| Hold | 4 °C | Hold | 1 |
Preparation of plasmid templates
Methods for plasmid extraction can be found in Zhang & Winfree (2009). Additional details on best practices for DNA plasmid preparation for cell-free expression systems can be found in Romantseva et al. (2022).
To obtain similar results to linear templates with plasmid templates, we have identified three crucial points:
After plasmid extraction from cells a secondary PCR clean up should be performed on the plasmids (we use the PureLink kit specified in materials)
We found high copy number plasmids produced results most comparable to linear templates. Low copy number plasmids (~10 copies) deviated from linear template results even when using nominally the same concentrations.
For plasmids Qubit concentration measurements are necessary to get close correlation to linear template results. Nanodrop measurements indicate much higher plasmid concentrations than Qubit measurements; this difference is not as great for linear templates.
Kinetic plate reader experiments
This protocol is for experiments demonstrating how to use toehold exchange riboregulators to obtain translational control of protein expression. Translation strength is controlled by varying the length of the d domain on the input strand. We will test 4 different d domain lengths: 1-base (low expression), 5-base (medium expression), 10-base (high expression), and 20-base (maximum expression). Additionally, we include a control that uses a decoy input (Io) that is not complementary to the toehold exchange riboregulator. This serves as the OFF state for the system. Io is included so that all 5 samples have the same total concentration of DNA template. This keeps the transcriptional load across all the samples the same to enable direct comparison of translational differences due to differences in d domain length. For experiments that vary the concentration of complementary inputs, we recommend adding Io to each sample such that the total DNA template concentration across all the samples is the same.
The protocol below is for testing the 5 samples described above with 3 technical replicates for each sample. The volumes of DNA templates to add to the reactions are based on stock concentrations of 100 nM.
Thaw cell-free expression reagents from -80 °C on ice.
a. PURExpress Solution A and Solution B or
b. Nucleus SMix, PMix, tRNA, and ribosomes
Thaw DNA templates (purified PCR products or plasmids), annealed molecular beacon, and HBC620 dye stock solution from -20 °C at room temperature.
While solutions are thawing, set up the plate reader protocol
a. Incubate samples at 37 °C
b. Set the protocol to conduct fluorescence measurements every 5 min, reading from the bottom of the plate
c. Set wavelengths for fluorescence measurements as described in Table 11
Add the DNA templates to 0.5 mL DNA LoBind tubes as specified in the first 4 columns of Table 12, then cap tubes.
a. Note the volumes in Table 12 assume 3 technical replicates with 10 % excess volume
Prepare Master Mix in Table 13 (PURExpress) or Table 14 (Nucleus Cytosol) in a 1.7 mL or 2 mL microfuge tube.
Pipette mix the Master Mix with a pipette volume set to 50 µL.
Add the volume of Master Mix specified in the 5th column of Table 12 to each of the DNA LoBind tubes.
Pipette mix each of the samples upon addition of the Master Mix.
Take 10 µL at a time from each sample in DNA LoBind tubes and transfer to a well in a 384-well plate; there should be 3 wells for each sample, corresponding to 3 technical replicates.
Check for bubbles and apply a clear plastic cover sheet to the plate.
Put the plate in plate reader and run the protocol.
Let reaction run for at least 4 hours.
Stop or pause the experiment in the plate reader software and remove the plate.
Add 3 µL of 10 µmol/L MB trigger RNA to each reaction well and pipette mix.
a. This step is only needed when using the molecular beacon (MB)
b. Addition of excess MB trigger RNA will cause all of the MB molecules in each well to react and release a fluorescent strand, allowing for an internal maximum fluorescence value of MB normalization in each well
Cover plate with a clear sheet, put back in the plate reader, and continue the measurements.
Let the reaction proceed for another hour or leave overnight.
Stop the experiment and export the data for analysis.
Table 11:Excitation and emission settings for the plate reader, assuming the plate reader has a monochromator.
| Component | EX (nm) | EM (nm) | Bandwidth | Gain |
|---|---|---|---|---|
| sCFP3A | 430 | 475 | 10 | 85 |
| Molecular beacon (MB) | 524 | 565 | 20 | 80 |
| Pepper-HBC620 complex | 577 | 620 | 20 | 75 |
| sfGFP | 485 | 510 | 10 | 75 |
Table 12:Volumes of DNA templates (from 100 nM stock concentrations) and Master Mix per sample. These volumes assume 3 technical replicates for each sample with 10 % excess volume.
| DNA template 1 | Volume (µL) per 33 µL | DNA template 2 | Volume (µL) per 33 µL | Master Mix volume (µL) |
|---|---|---|---|---|
| Io | 1.65 | G_1 | 1.65 | 29.70 |
| IN_2 | 1.65 | G_1 | 1.65 | 29.70 |
| IN_3 | 1.65 | G_1 | 1.65 | 29.70 |
| IN_4 | 1.65 | G_1 | 1.65 | 29.70 |
| IN_1 | 1.65 | G_1 | 1.65 | 29.70 |
Table 13:Components and volumes for reactions in PURExpress. The Volume column is how much to add for one sample assuming 3x technical replicates with 20 % excess. The Master Mix column is how much of each component to add to prepare the master mix for all 5 reactions in this demonstration. Solution A must be added before Solution B.
| Component | [Stock] nmol/L | [Final] nmol/L | Volume (µL) per 36 µL | Master Mix (5 samples) |
|---|---|---|---|---|
| Solution A | — | — | 14.40 | 72.00 |
| Solution B | — | — | 10.80 | 54.00 |
| Molecular beacon (MB) | 20000 | 500 | 0.90 | 4.50 |
| HBC620 dye | 1000000 | 5000 | 0.18 | 0.90 |
| H2O | — | — | 6.12 | 30.60 |
| DNA templates | 100 | 5 | Individually | Individually |
Table 14:Components and volumes for reactions in Nucleus Cytosol. The Volume column is how much to add for one sample assuming 3x technical replicates with 20 % excess. The Master Mix column is how much of each component to add to prepare the master mix for all 5 reactions in this demonstration.
| Component | [Stock] nmol/L | [Final] nmol/L | Volume (µL) per 36 µL | Master Mix (5 samples) |
|---|---|---|---|---|
| SMix | 10000 | 3000 | 10.80 | 54.00 |
| tRNA | 10000 | 1000 | 3.60 | 18.00 |
| PMix | 10000 | 1200 | 4.32 | 21.60 |
| Ribosomes | 10000 | 2400 | 8.64 | 43.20 |
| Molecular beacon (MB) | 20000 | 500 | 0.90 | 4.50 |
| HBC620 dye | 1000000 | 5000 | 0.18 | 0.90 |
| H2O | — | — | 0.96 | 4.80 |
| DNA templates | 100 | 5 | Individually | Individually |
Results
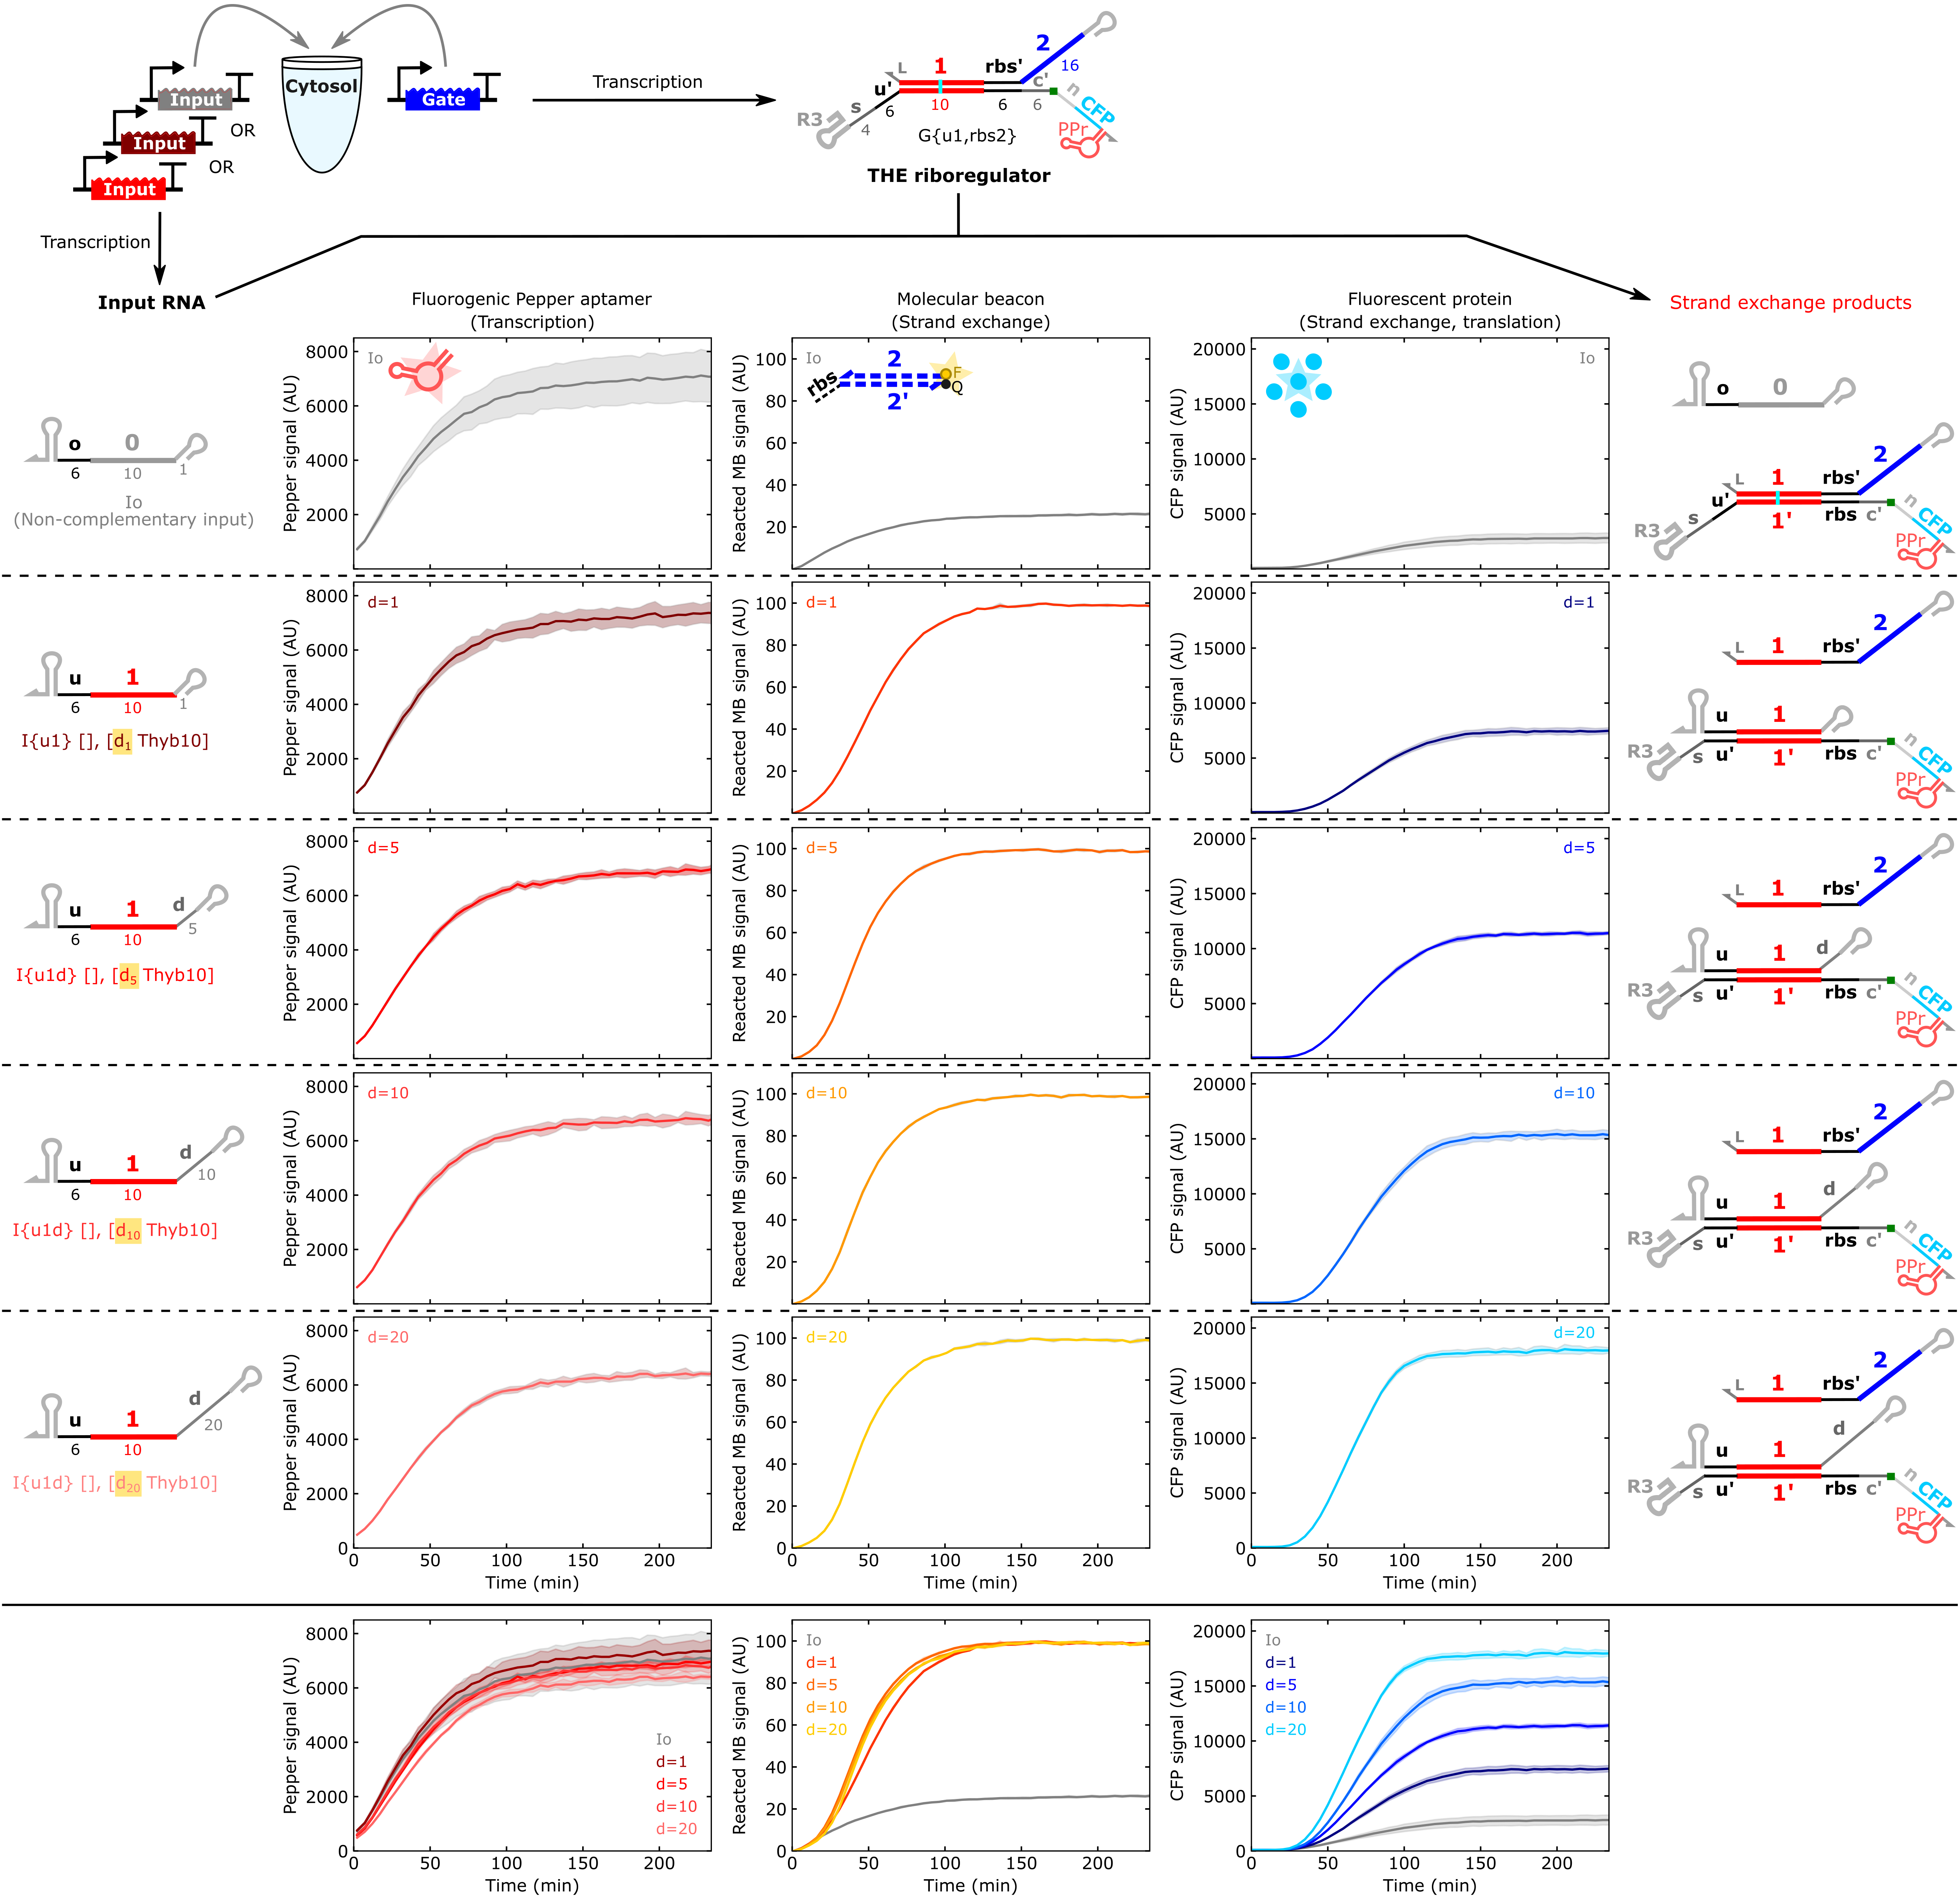
Figure 2:Experimental results in PURExpress. Kinetic results of a THE riboregulator cotranscribed with input RNAs possessing d domains of increasing length. Lines and shading in each plot represent the mean and standard deviation, respectively, from 3 technical replicates. The fluorogenic Pepper aptamer provides a measure of initial transcription rate of the gate, the molecular beacon provides a measure of output RNA release, and CFP provides a measure of translation rate from the gate in the ON state.
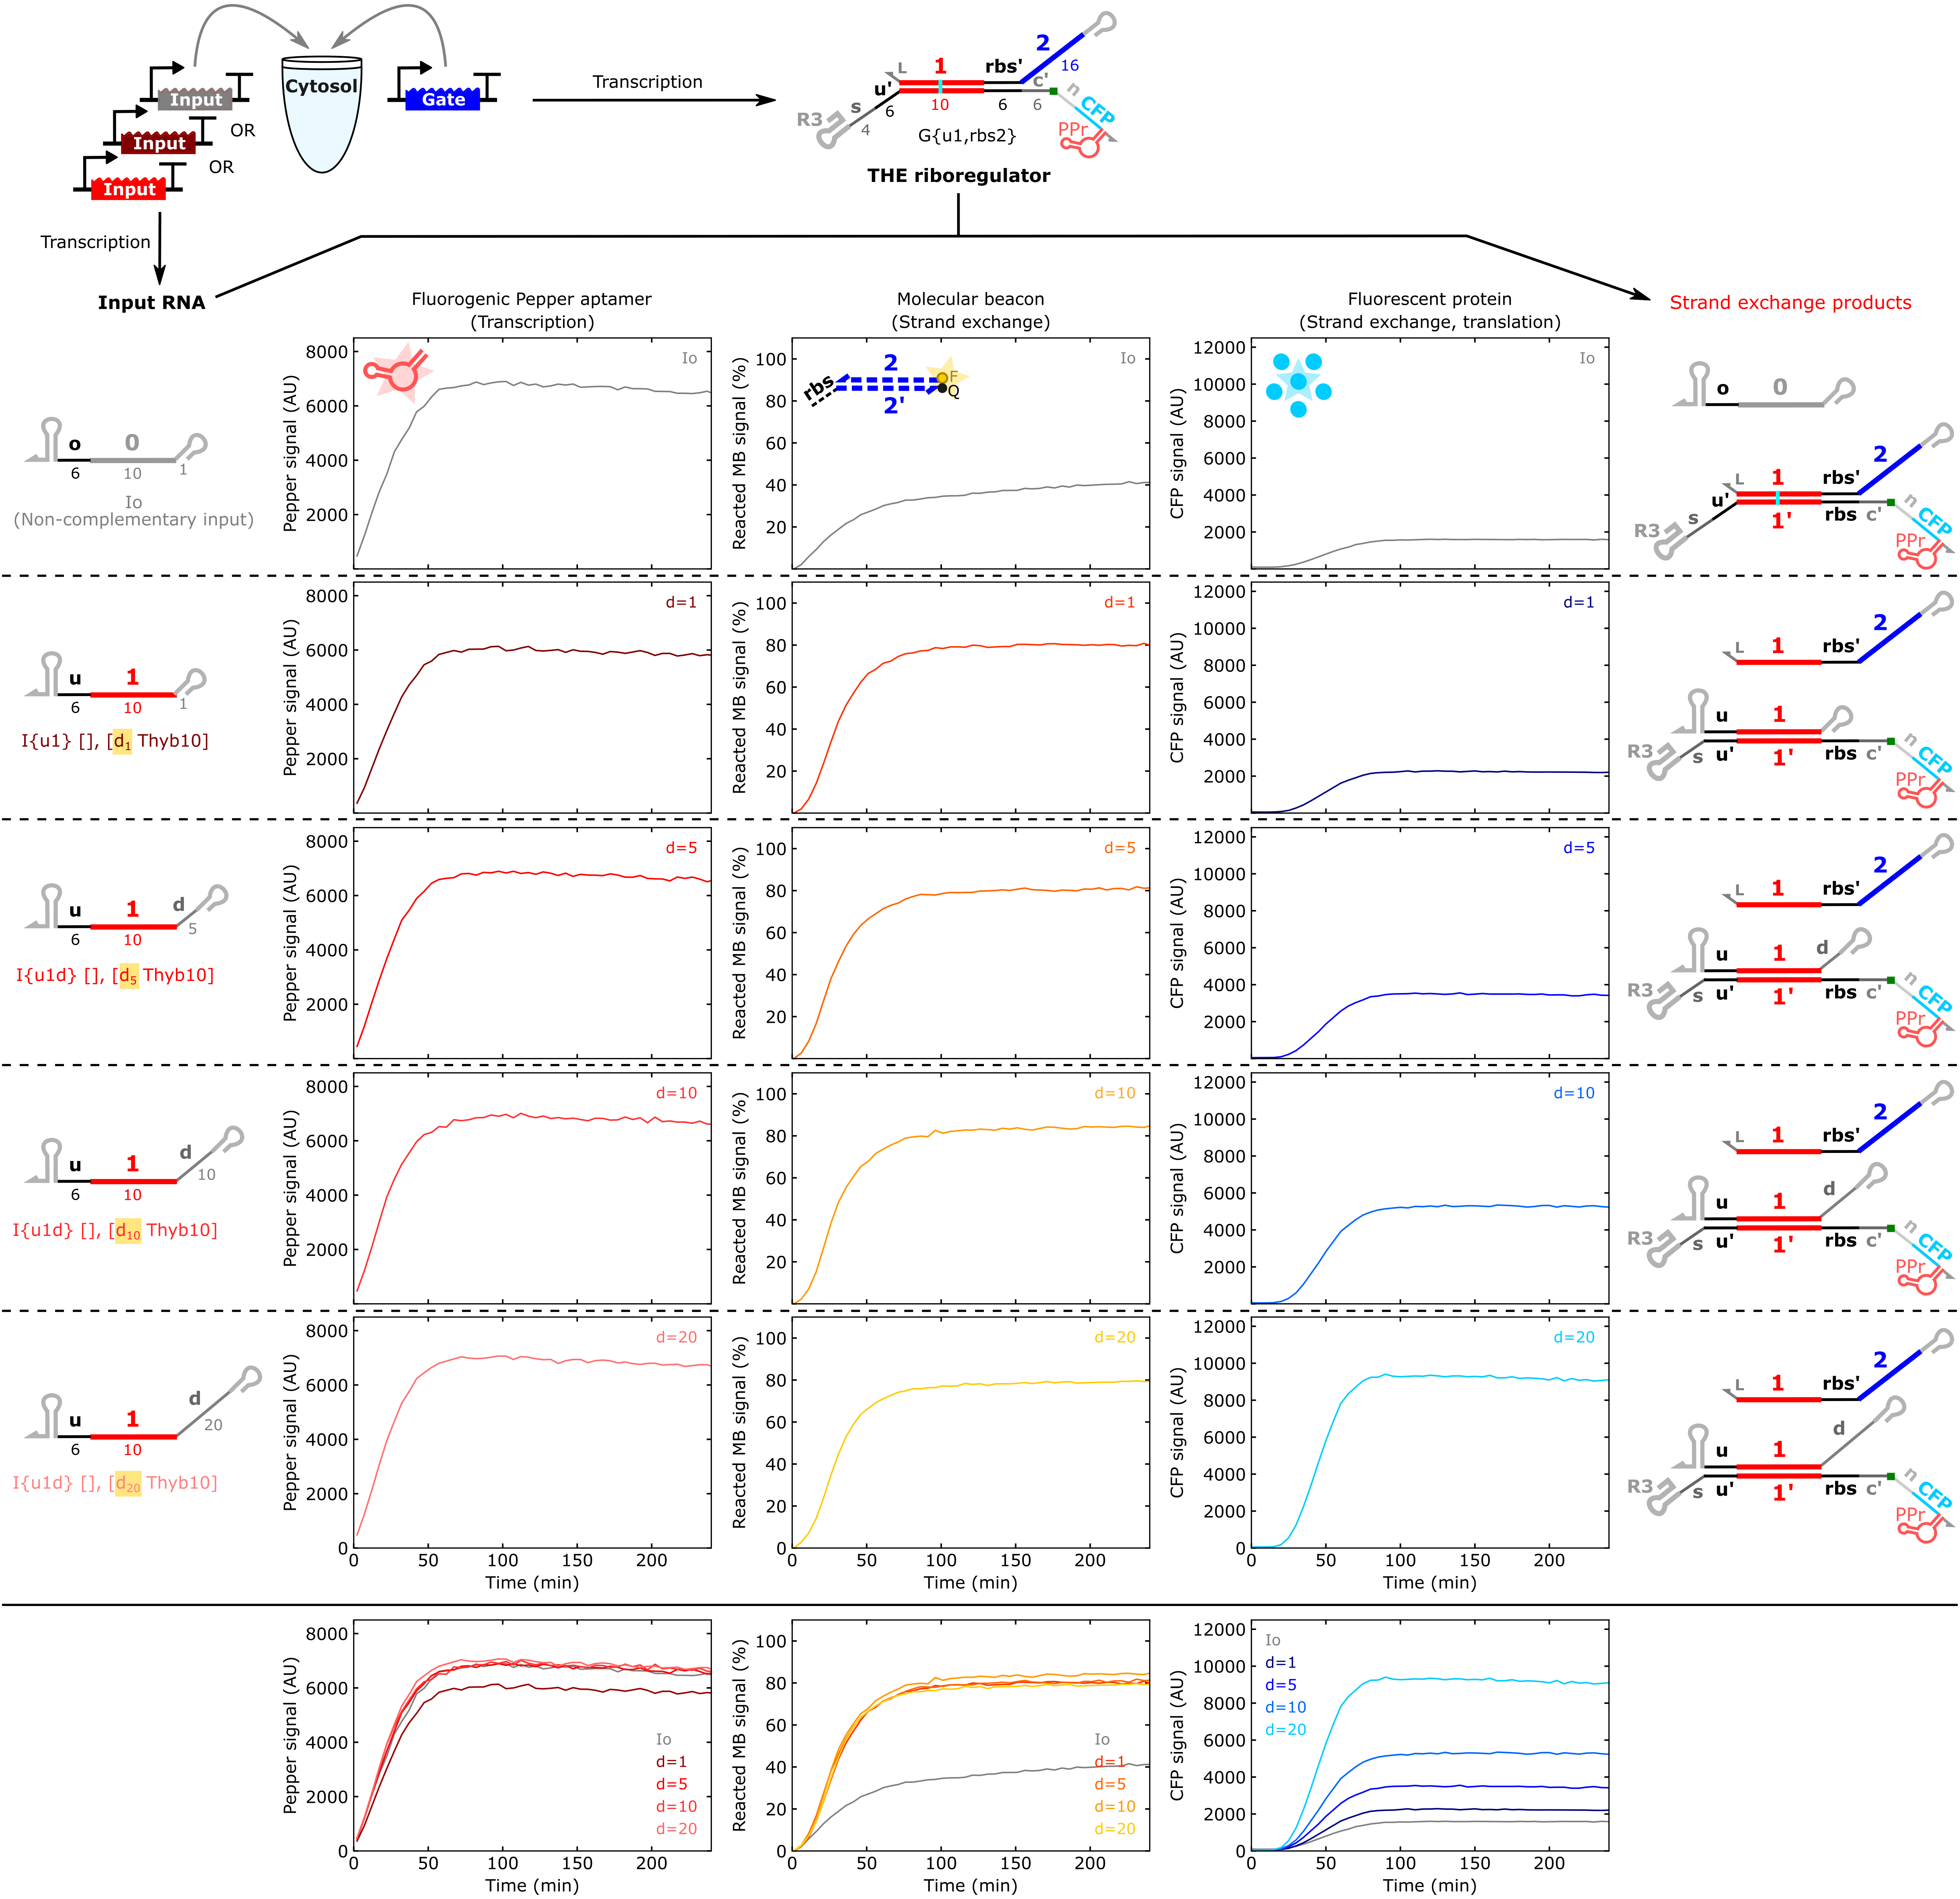
Figure 3:Experimental results in Nucleus Cytosol. Kinetic results of a THE riboregulator cotranscribed with input RNAs possessing d domains of increasing length. Only a single replicate was run for each sample in these experiments. The fluorogenic Pepper aptamer provides a measure of initial transcription rate of the gate, the molecular beacon provides a measure of output RNA release, and CFP provides a measure of translation rate from the gate in the ON state.
Resources
Analysis Notebooks
Two analysis notebooks accompany this DevNote:
PURExpress Analysis (
experiments/20250311-PURExpress-THE/analysis.ipynb)Nucleus Cytosol Analysis (
experiments/20260512-Cytosol-THE/analysis.ipynb)
These notebooks were developed in the authors’ local Windows environment and contain hardcoded file paths and dependencies on custom local modules. They are included for transparency but are not independently runnable without environment setup by the original authors. Both notebooks are available in the computational archive linked at the top of this page.
External Tools and Sequences
ctRSD and THE riboregulator sequence compiler
Documentation: ctrsd
-simulator .readthedocs .io CoLab: sequence compiler CoLab
Annotated sequence / plasmid maps
Credits
Developers
NIST Cellular Engineering Group Link
Samuel Schaffter, Fernanda Piorino, Eugenia Romantseva
License
The text and figures in this DevNote are made available under the Creative Commons Attribution 4.0 International (CC BY 4.0) license. The content of this DevNote is not subject to the CERN Open Hardware Licence – Permissive (CERN-OHL-P). The corresponding author, Samuel W. Schaffter, is an inventor on two patent applications pertaining to ctRSD circuits (PCT/US2022/053229) and THE riboregulators (PCT/US25/13610).
- Zhang, D. Y., & Winfree, E. (2009). Control of DNA Strand Displacement Kinetics Using Toehold Exchange. Journal of the American Chemical Society, 131(47), 17303–17314. 10.1021/ja906987s
- Piorino, F., Romantseva, E., & Schaffter, S. W. (2025). Cell-free systems enable mechanistic characterization of genetically encoded RNA strand exchange circuits for programmable protein expression. 10.1101/2025.09.25.678518
- Schaffter, S. W., Vasilyeva, O. B., Wintenberg, M. E., Hurley, J. M., & Alperovich, N. Y. (2025). Genetically encoded RNA strand exchange circuits for programmable protein expression and computation in cells. 10.1101/2025.09.24.678369
- Schaffter, S. W., & Strychalski, E. A. (2022). Cotranscriptionally encoded RNA strand displacement circuits. Science Advances, 8(12). 10.1126/sciadv.abl4354
- Schaffter, S. W., Wintenberg, M. E., Murphy, T. M., & Strychalski, E. A. (2023). Design Approaches to Expand the Toolkit for Building Cotranscriptionally Encoded RNA Strand Displacement Circuits. ACS Synthetic Biology, 12(5), 1546–1561. 10.1021/acssynbio.3c00079
- Bae, W., Stan, G.-B. V., & Ouldridge, T. E. (2020). In situ Generation of RNA Complexes for Synthetic Molecular Strand-Displacement Circuits in Autonomous Systems. Nano Letters, 21(1), 265–271. 10.1021/acs.nanolett.0c03629
- Karolchik, D., Barber, G. P., Casper, J., Clawson, H., Cline, M. S., Diekhans, M., Dreszer, T. R., Fujita, P. A., Guruvadoo, L., Haeussler, M., Harte, R. A., Heitner, S., Hinrichs, A. S., Learned, K., Lee, B. T., Li, C. H., Raney, B. J., Rhead, B., Rosenbloom, K. R., … Kent, W. J. (2013). The UCSC Genome Browser database: 2014 update. Nucleic Acids Research, 42(D1), D764–D770. 10.1093/nar/gkt1168
- Romantseva, E., Alperovich, N., Ross, D., Lund, S. P., & Strychalski, E. A. (2022). Effects of DNA template preparation on variability in cell-free protein production. Synthetic Biology, 7(1). 10.1093/synbio/ysac015