

Setup
!pip install nucleus-cdk==0.5.0rc2 | tail -n2Analyze time-series fluorescence data from PURE (Protein synthesis Using Recombinant Elements) experiments.
Setup
%load_ext autoreload
%autoreload 2

import pandas as pd
import seaborn as sns
import matplotlib.pyplot as plt

from cdk import logging
log = logging.setup_logging(logging.ERROR)

# Import the cdk platereader module
# from cdk.analysis.cytosol import platereader as pr
import cdk.instruments.platereader as pr
Load Data
# Specify file paths
data_file = "20260604-113617-cytation5-pure-timecourse-gfp.txt"
platemap_file = "new-platemap.csv"


# Load data
result = pr.load_platereader_data(
    data_file=data_file,
    platemap_file=platemap_file,
    platereader="biotek"  # Options: "cytation", "envision", "biotek-cdk"
)

# Checkout first few rows
print(result)
[06/15/26 14:04:38] INFO Found 1 plate blocks biotek.py:105
INFO Parsing plate block 1 biotek.py:112
INFO Read metadata section, found 2 read biotek.py:213
block(s).
INFO Parsed 2 segment(s) successfully. biotek.py:466
INFO Found 0 segment(s) that could not be biotek.py:467
associated with existing read data.
WARNING Platemap 'Type' column contains platemap.py:141
unexpected values: ['Control'].
Expected one of: ['Blank',
'Negative Control', 'Positive
Control', 'Sample', 'Standard'].
PlateReaderResult with the following 2 blocks:
0: (876, 38) kinetic read with reads: GFP-G70:485,528 (Fluorescence) (Plate 'Plate 1')
1: (876, 38) kinetic read with reads: GFP-Gext:485,528 (Fluorescence) (Plate 'Plate 1')
data = result[1]Plot Raw Curves
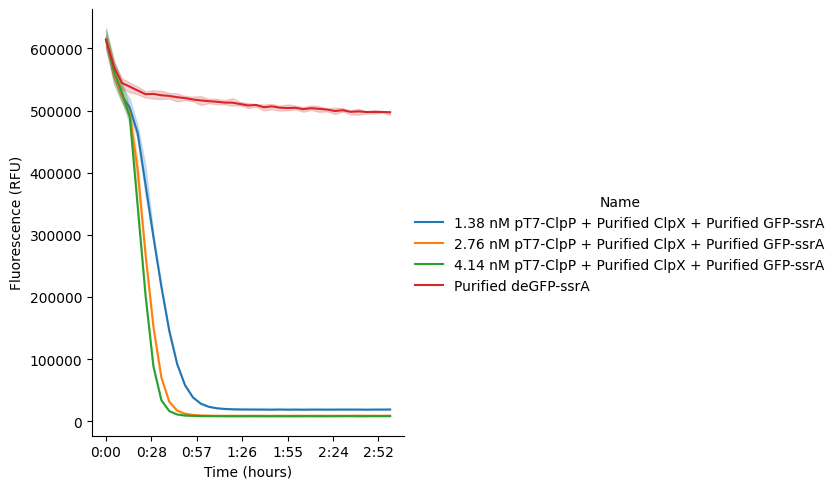
#g = data.plot(style='Type')
g = data.plot()
g.savefig('raw', dpi=300)