Analyze: Insertion Assay
import matplotlib.pyplot as plt
import matplotlib.image as mpimg

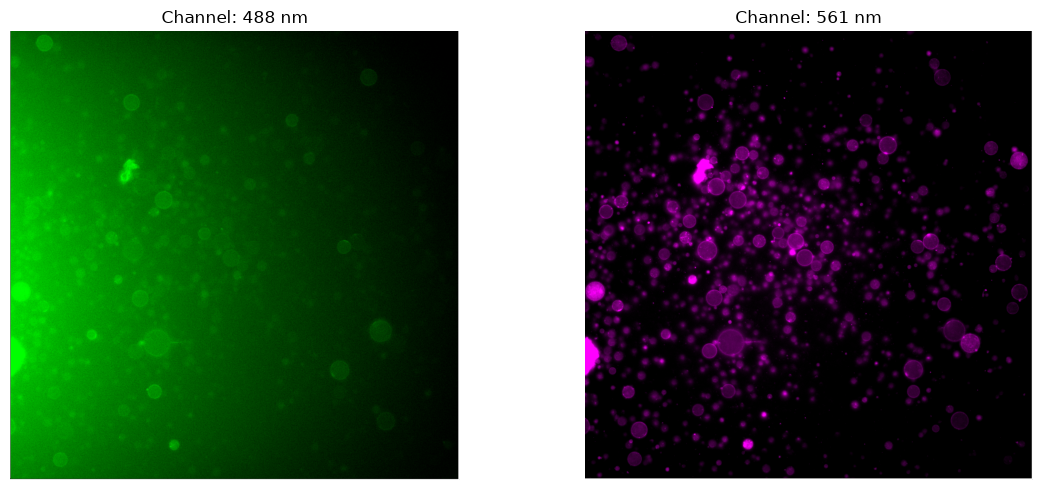
file_path_1 = "Control/Control 1-488.png"
file_path_2 = "Control/Control 1-561.png"

# Read the image files
img1 = mpimg.imread(file_path_1)
img2 = mpimg.imread(file_path_2)

# Create a figure with 1 row and 2 columns
fig, (ax1, ax2) = plt.subplots(1, 2, figsize=(12, 5))

# Display the images
ax1.imshow(img1)
ax1.set_title('Channel: 488 nm')
ax1.axis('off')  # Hide axes

ax2.imshow(img2)
ax2.set_title('Channel: 561 nm')
ax2.axis('off')  # Hide axes

plt.tight_layout()
plt.show()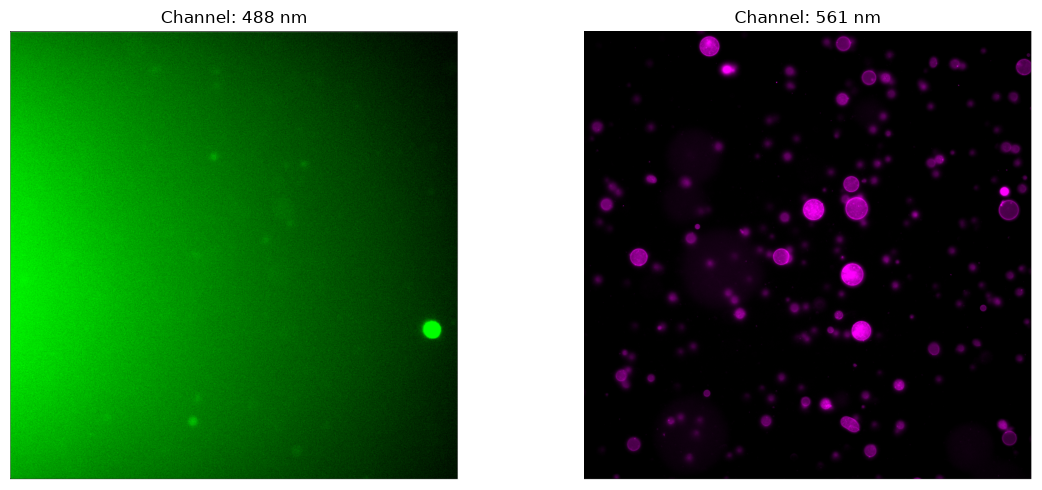
import matplotlib.pyplot as plt
import matplotlib.image as mpimg

file_path_1 = "Sample/Sampe 1- 488.png"
file_path_2 = "Sample/Sample 1-561.png"

# Read the image files
img1 = mpimg.imread(file_path_1)
img2 = mpimg.imread(file_path_2)

# Create a figure with 1 row and 2 columns
fig, (ax1, ax2) = plt.subplots(1, 2, figsize=(12, 5))

# Display the images
ax1.imshow(img1)
ax1.set_title('Channel: 488 nm')
ax1.axis('off')  # Hide axes

ax2.imshow(img2)
ax2.set_title('Channel: 561 nm')
ax2.axis('off')  # Hide axes

plt.tight_layout()
plt.show()