

DevCells: Kickoff Workshop
Abstract
The Kickoff Workshop for the DevCells Project was held at Nucleus Labs in San Francisco, bringing together 19 participants from the Chicago, London, San Francisco, and San Luis Obispo nodes. The workshop allowed participants to dive deep into their demonstration projects and understand how participants’ individual contributions could be cast as Nucleus Modules, suitable for reuse by the broader synthetic cell community. The workshop provided hands-on training in working with Nucleus Cytosol and Nucleus Cell. Participants were also trained to use the Nucleus Ecosystem for data analysis, including the Cell Developer Kit (CDK), and to publish DevNotes for rapid sharing of results and insights. This first-of-a-kind event provides us with valuable insights for organizing future integrated cell building efforts that involve multi-institute, interdisciplinary collaborations.
Overview
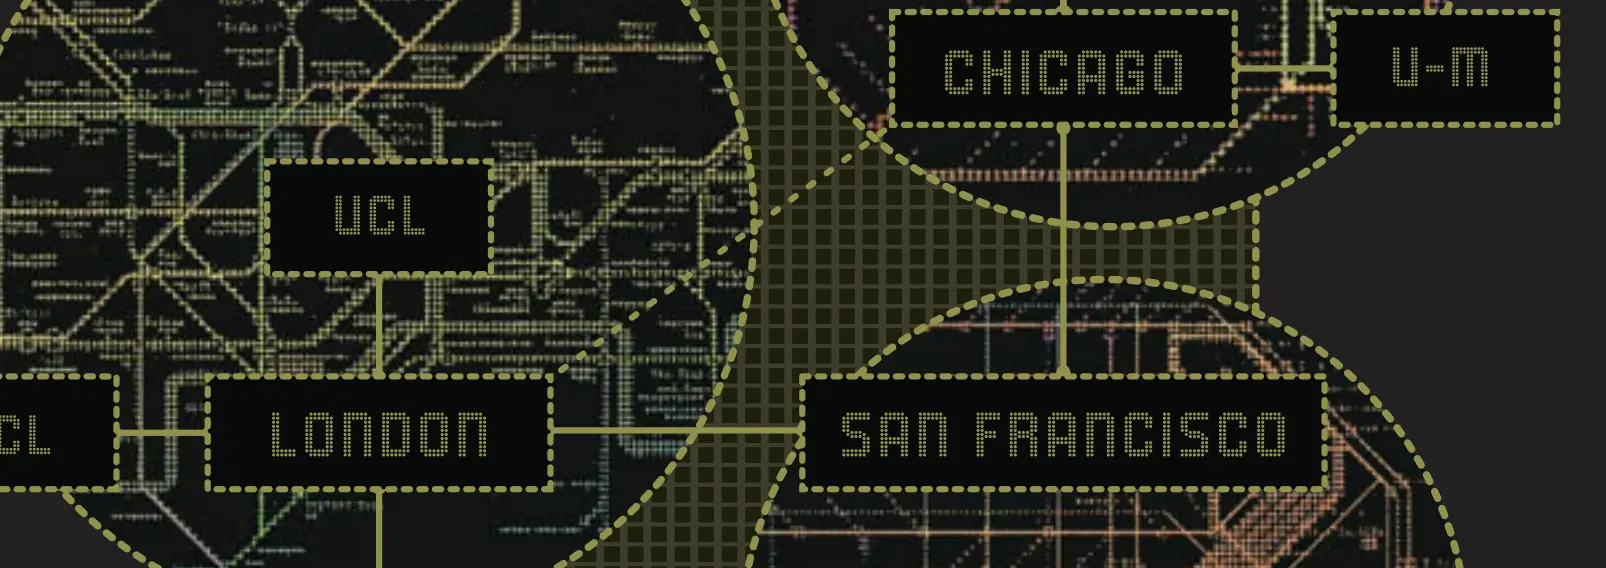
On December 8, 2025, 20 participants gathered at Nucleus Labs in San Francisco to kickoff the Developer Cells (DevCells) program (Figure 1 and Figure 2). This program brings together scientists and engineers with expertise ranging from synthetic biology to materials science representing six different institutions organized into four nodes to build with and extend Nucleus (Table 1). Two nodes (London and Chicago) will be creating demonstration projects built from integrated synthetic cell components. A third node based in San Francisco will work to ensure that the components developed by the first two nodes are reproducible and sufficiently documented for inclusion on Nucleus. A fourth node based in San Luis Obispo will make use of these components to introduce synthetic cells to an undergraduate audience.
| Node | Institutions | # of Workshop Participants |
|---|---|---|
| Chicago | Northwestern University, University of Michigan | 7 |
| London | Imperial College, King’s College, University College | 6 |
| San Francisco | b.next | 6 |
| San Luis Obispo | CalPoly SLO | 1 |
The workshop had two primary goals:
Sync on Node Plans: create a space to discuss and refine the development plan for the demonstration projects;
Introduction to Nucleus: introduce participants to Nucleus Platform including Cytosol, Developer Notes (DevNotes), Hub, and the Cell Development Kit (CDK).

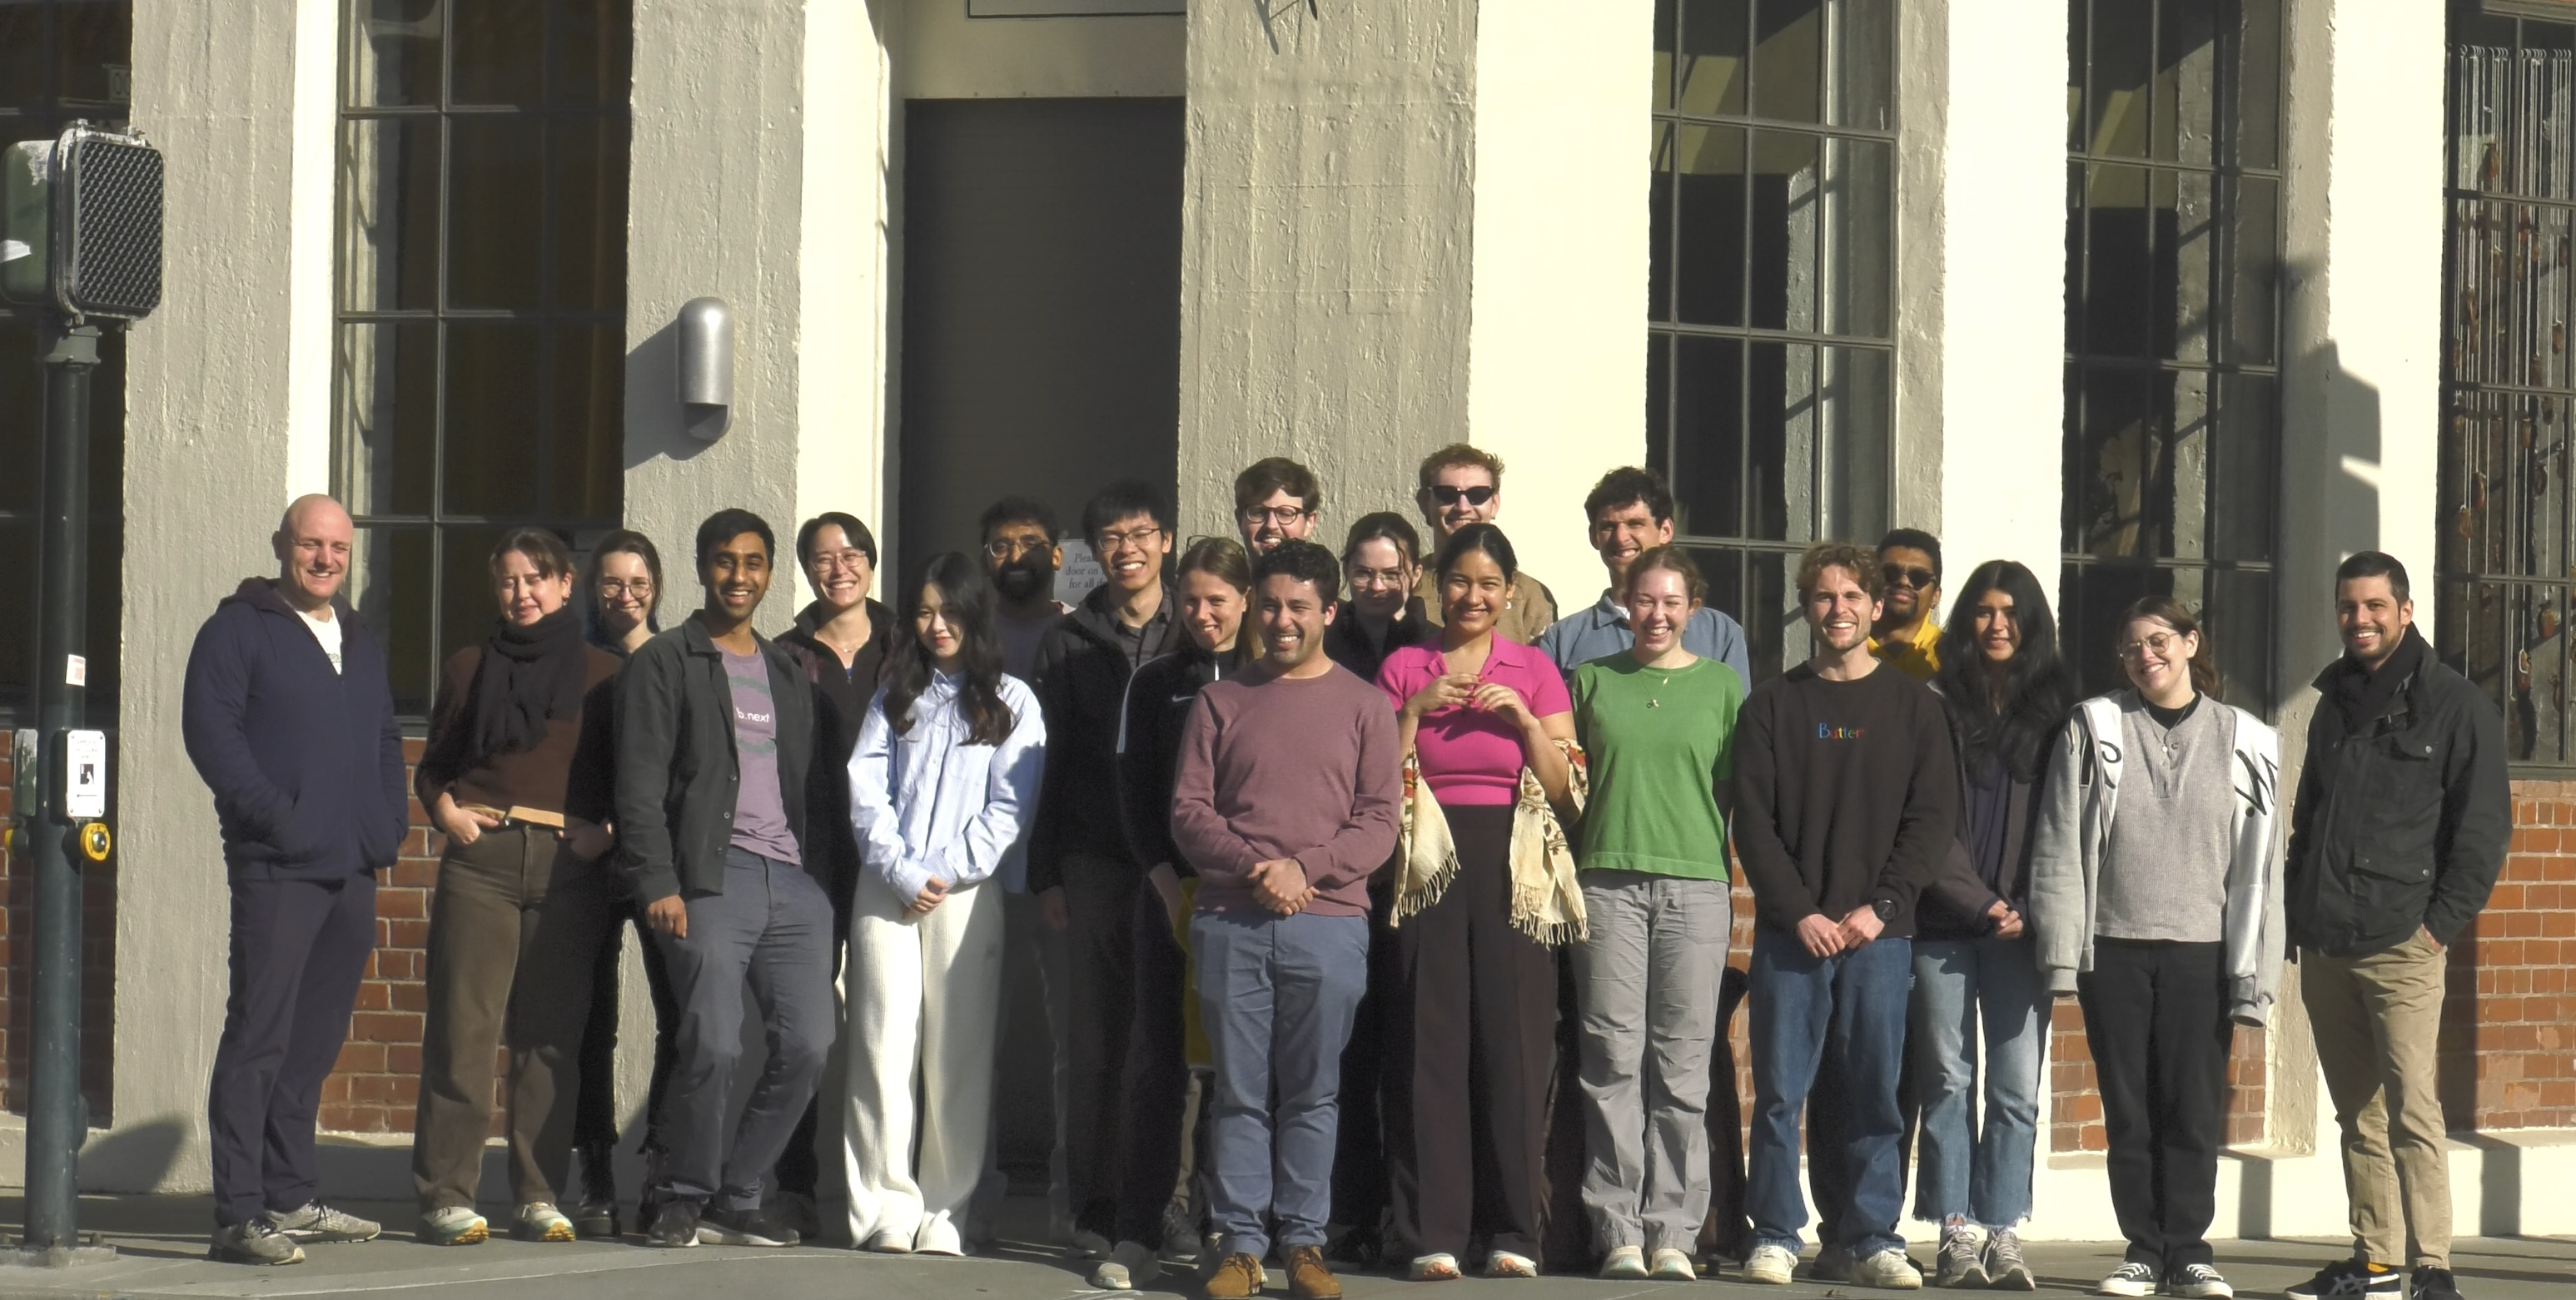
Figure 2:Photo of workshop participants.
Syncing on Node Plans
The DevCells program requires coordination at multiple levels.
Intra-node alignment: members of each node must understand how their individual contributions fit together to realize the demonstration project.
Cross-node overlap: members of each node should identify shared problems, duplicated efforts, opportunities to coordinate in other nodes.
Reproducibility pathway: members of each node should understand how they will use Nucleus and work with the core development team at b.next to ensure that their development efforts are sufficiently documented for inclusion into Nucleus.
To ensure that these coordination needs are addressed we organized several structured sessions to surface project needs and open questions (Figure 3). These sessions also created space for participants to articulate the details of their individual contributions, how these contributions can be understood as reusable Nucleus Modules (Figure 4), and how those contributions will come together in the final demonstration projects (Figure 5 and Figure 6). What follows are the key themes that we identified during these discussions.

Figure 3:Open questions and needs were identified in collaborative brainstorming sessions
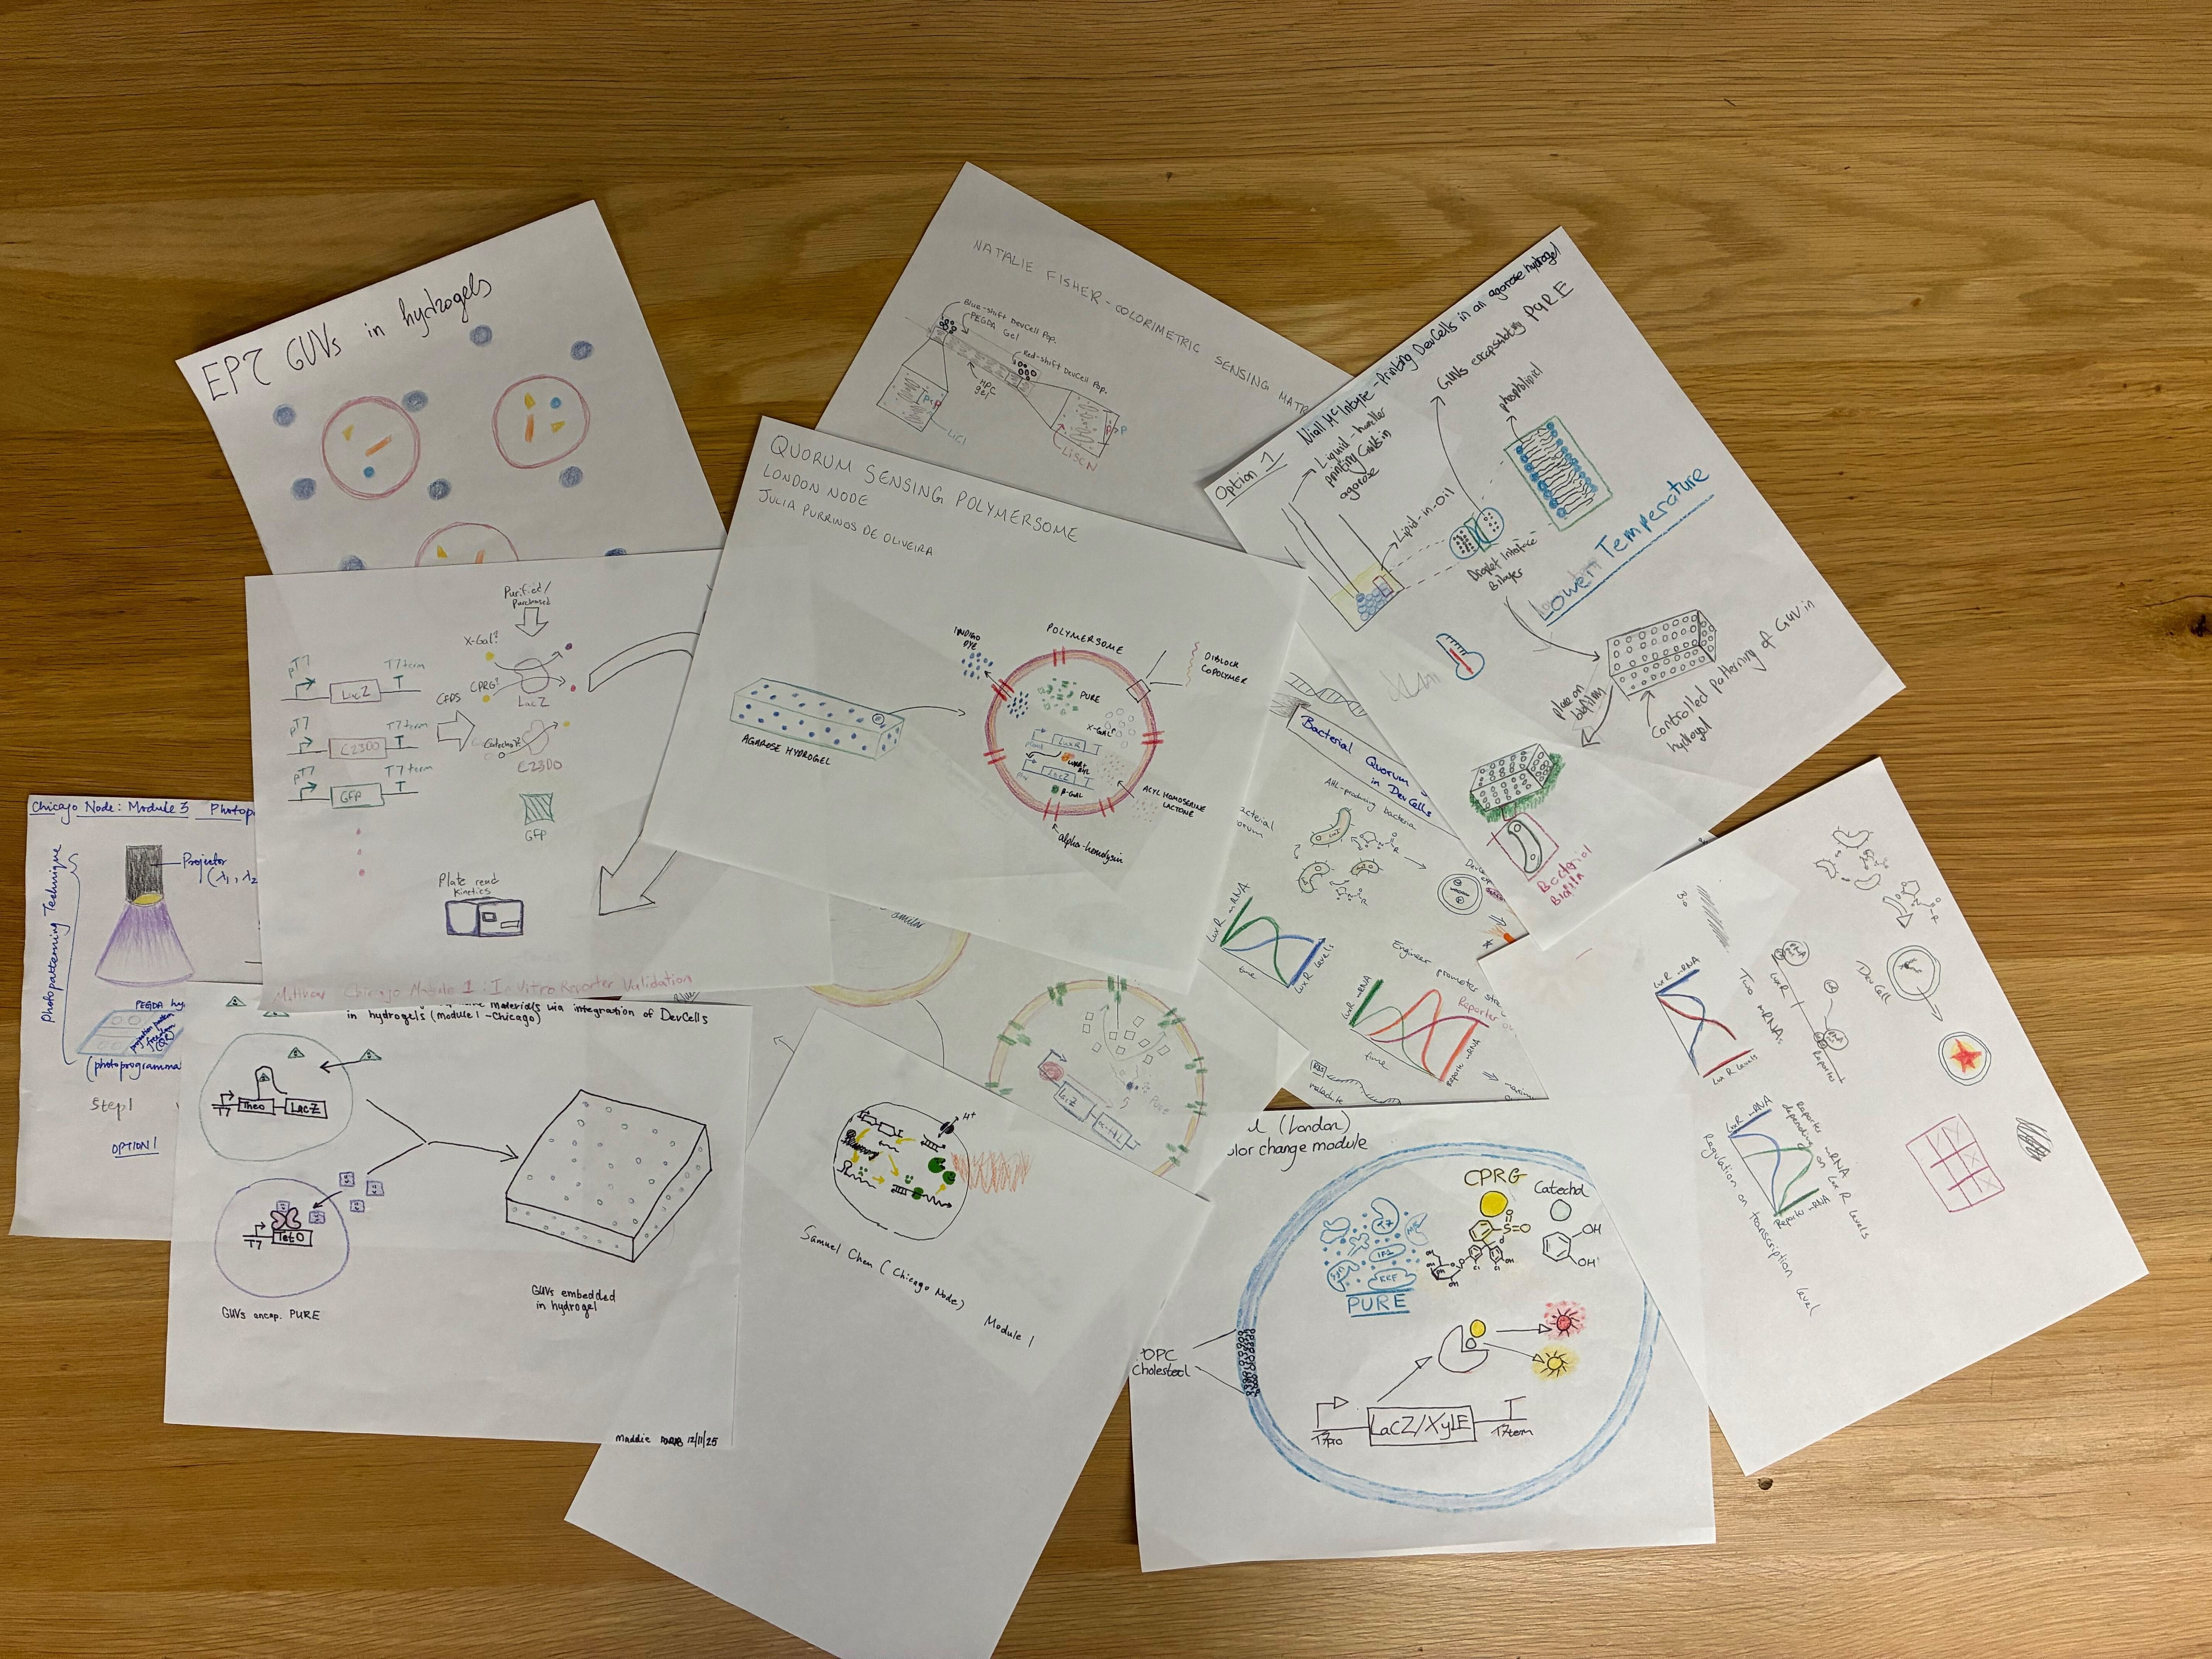
Figure 4:Participants introduced their modules to one another through drawing.

Figure 5:Chicago Node participants diagramed their integrated system and introduced it to the other project participants.

Figure 6:London Node participants diagramed their integrated system and introduced it to the other project participants.
Key Themes: Engineering, Integration, and Connections
Shared Understanding: language, communication, and context
Given the incredible diversity of participant backgrounds both in terms of area of expertise (membrane biophysics, materials science, biosensors) and home institutions, the need to develop shared language and context could not be overstated. We found that the terms “module”, “process”, and “capacity” were often referred to and useful but often used in different ways by different people. We aligned on the following definitions:
Module: a well-defined component which performs a task in the biological system (e.g., a genetic circuit which senses a molecule, a hydrogel matrix that provides a color-change output).
Process: a technique, protocol, or process which is used to build, integrate, or work with a Developer Cell (e.g., phase-transfer encapsulation, 3D printing).
Capacity: the ability to perform a process in service of building a Developer Cell. More specifically, the superpower of having people or labs within each node focused on operating a capacity to enable other participants to work better and faster (e.g., cell-free circuit validation, diffusion characterization, modeling).
Once we had established a shared language and understanding of the modules needed to be integrated into the demonstration, it became possible to more clearly articulate project dependencies and requirements. Through these discussions we identified a few hidden parts, any necessary components that are hidden in the dependency tree. For example, we identified several modules (e.g. E. coli RNA polymerase, alpha-hemolysin) that were either unspecified or not clearly assigned to a person.
Shared Problems and Solutions: an opportunity to move faster by working together
By bringing project participants together in the same room, we could identify complementary expertise across labs and nodes.
Inter-node Collaboration: both nodes desire (and are planning to determine by experiment) information about or optimization of the same thing. For example, diffusion rates of small molecules through liposome membranes or hydrogels, lipid compositions which are compatible with various hydrogels, sensitivity of Developer Cells to hydrogel crosslinkers (UV, free-radical generation). Coordinating and centralizing this work would save time and effort (though, as a complement, replicating results at least once would improve reliability).
Methods and Protocols: shared data, methods, and consistent approaches will enable us to make use of, and trust, one another’s work. We used a consistent fluorescent standard for our plate reader experiments, which we will use to normalize to concrete eGFP concentration standards. However, such a tool does not yet exist for cell microscopy data, and developing one together would enable more effective work both within and beyond the project.
Group Knowledge: many questions had answers that were already known, or could be found rapidly with the help of others across the group. We should find ways to leverage the variety of skill and experience effectively within and between all the nodes.
Shared Platform: how can we build in similar and interoperable ways
Facilitating these discussions while also introducing the Nucleus Platform in parallel made it natural to think of what kind of platform improvements would immediately enable the project participants.
Sensible defaults: what are our default settings for ways to run protocols, compositions of modules, etc. To ensure that modules work together, we should strive to make the minimal necessary changes from these defaults (for example, preferring the same lipid composition for liposome membranes). Likewise, we should optimize systems using the more flexible parameters; to the extent modules already work with a given composition we should maintain it and make other components work with that.
Enabling technology: what could we build (or cause to be built) that would help the work proceed? Critical needs will likely be unearthed over the course of the project.
Project Risks
Several key project-level risks were identified that are worth highlighting here:
Business as usual: if we operate as a research collaboration, rather than an engineering project, we will likely fall short of our goals. We need clear milestones and project participants at all levels should be enabled and empowered to prioritize, specialize, and collaborate.
Specificity of design: if we co-optimize every component, modules won’t be interoperable beyond the demo, node, project.
Ambiguity: unknown or yet-to-be decided details prevent forward motion elsewhere; likewise late changes will have an amplified effect. Technical and planning ambiguity must be knocked down as rapidly as possible (e.g., specific molecules and their performance, hydrogel compositions). When in doubt, we likely want to choose simpler or better-understood options if we can.
Introduction to Nucleus
The workshop provided hands-on training in working with Nucleus Cytosol and Nucleus Cell. Participants were also trained to use tools within the Nucleus Platform for data analysis, including the Cell Developer Kit (CDK), and to publish DevNotes for rapid sharing of results and insights (Figure 7).

Figure 7:Components of the Nucleus Platform.
Cytosols
Nucleus Cytosol was used to set up Cytosol reactions incorporating either the creatine phosphate/creatine kinase (CP/CK) module or the polyphosphate kinase/polyphosphate (PPK/PolyP) module for ATP regeneration. Polyphosphate kinase (PPK2) [EC 2.7.4.1] from Cytophaga hutchinsonii was used in the PPK/PolyP module to regenerate ATP.
Four reaction conditions were prepared:
a CP/CK reaction,
a PPK/PolyP reaction,
a DNA-negative control lacking the pOpen-deGFP DNA template, and
a PPK-negative control lacking the PPK2 enzyme.
Reaction compositions and descriptions are provided in Table 2 and Table 3, respectively. To eliminate ATP regeneration by the CP/CK module, a small molecule mix (SMix) was prepared without creatine phosphate, SMixΔCP, and used for both the PPK/PolyP and ΔPPK reactions. SMix and SMixΔCP contain magnesium acetate and supply 8 mM magnesium acetate to the final reaction. Additional magnesium acetate was added to the PPK/PolyP and ΔPPK reactions to reach 16 mM total magnesium, as the PPK/PolyP system requires a higher concentration.
Participants were divided into two groups, and each participant prepared one of the four reaction types. Within each group, three different participants independently assembled the CP/CK and PPK/PolyP reactions to evaluate reproducibility of both the Cytosol system and the protocol across users. Each participant prepared a 35 μL mastermix and dispensed 10 μL aliquots in triplicate into a 384-well plate for GFP fluorescence measurements. A Bill of Materials listing all materials and sources is attached to this DevNote.
Table 2:Reaction Compositions
| Component | Input Concentration | Final Concentration in Reaction | CP/CK [µL] | PPK/PolyP [µL] | ΔPPK Negative Control [µL] | ΔDNA Negative Control [µL] |
|---|---|---|---|---|---|---|
| SMix | 3.33X | 1x | 10.5 | 0 | 0 | 10.5 |
| SMixΔCP | 3.33X | 1X | 0 | 10.5 | 10.5 | 0 |
| tRNA | 35 mg/mL | 3.5 mg/mL | 3.5 | 3.5 | 3.5 | 3.5 |
| PMix | 15 mg/mL | 1.8 mg/mL | 4.2 | 4.2 | 4.2 | 4.2 |
| Ribosomes | 10 µM | 1.8 µM | 6.3 | 6.3 | 6.3 | 6.3 |
| RNAse Inhibitor, Murine | 40,000 U/mL | 2000 U/mL | 1.75 | 1.75 | 1.75 | 1.75 |
pOpen-deGFP DNA template | 124 nM | 3 nM | 0.85 | 0.85 | 0.85 | 0 |
| Magnesium acetate | 200 mM | 8 mM | 0 | 1.4 | 1.4 | 0 |
| PPK2 | 57 µM | 2 µM | 0 | 1.22 | 0 | 0 |
| PolyP | 500 mM | 30 mM | 0 | 2.10 | 2.10 | 0 |
| Water | 7.9 | 3.18 | 4.4 | 8.75 | ||
| Total master mix volume [µL] | 35 | 35 | 35 | 35 |
Kinetics
The protein expression results indicate that Nucleus Cytosol using the CP/CK module performed consistently and reproducibly across participants in both Group 1 and Group 2, as shown in Figure 8 and Figure 9, respectively. A 1 µM NIST-traceable fluorescein standard was included in all Cytosol experiments, and fluorescence data were normalized to the 1 µM fluorescein signal.
In contrast, variation was observed in expression kinetics and final protein yield among participants who prepared the PPK/PolyP reactions. These differences may be attributable to pipetting variability, as the PPK protein stock contains glycerol and is more difficult to dispense accurately, which could lead to differences in the effective PPK concentration across reactions.
The DNA-negative control showed no detectable protein expression in either group, as expected. The PPK-negative control showed measurable expression in Group 1, which may have resulted from accidental addition of the PPK enzyme or from background protein expression supported by endogenous NTPs present in the SMix. However, if endogenous NTPs were the cause, comparable background expression would be expected in the Group 2 PPK-negative control, which was not observed.
Table 3:Description of Reactions
| Name | Description |
|---|---|
| CP/CK_, where | Cytosol reaction expressing deGFP using CP/CK as an ATP regeneration module |
| PolyP/PPK_, where | Cytosol reaction expressing deGFP using PPK/PolyP as an ATP/GTP regeneration module |
| -PPK or ΔPPK Negative Control | Negative control reaction for PPK/PolyP reaction, without the PPK2 enzyme |
| -DNA or ΔDNA Negative Control | Negative control reaction without pOpen-deGFP DNA template |


Kinetics summary
Additional kinetic fit data for Group 1 and Group 2 are provided in the dropdown below as Figure 10 and Figure 11, respectively. The kinetic analysis reports three key metrics for each reaction:
Time to reach steady state (tsteadystate): The time required for the reaction to reach its final steady-state fluorescence level.
Maximum velocity (Vmax): The steepest slope of the fluorescence curve at its inflection point. This reflects the peak rate of protein synthesis and is sensitive to enzyme activity, substrate availability, and reaction conditions. Units are reported in RFU/hour.
Lag time (tlag): The time before the onset of exponential fluorescence increase. This may reflect ribosome assembly or early translation steps, or may be influenced by fluorescent protein maturation. Shorter lag times indicate faster reaction initiation.
Kinetic summaries for all reactions (except negative controls) in Group 1 and Group 2 are presented in Figure 12 and Figure 13, respectively, including protein expression kinetics, steady-state fluorescence levels, maximum velocity (Vmax), and drift. Drift measures the rate of fluorescence change after the reaction has reached steady state. Positive drift indicates continued synthesis or aggregation, whereas negative drift reflects photobleaching, protein degradation, or quenching. Units are reported in RFU per second.

Figure 12:Group 1 Kinetics Summary

Figure 13:Group 2 Kinetics Summary
Cells
Participants also performed cytosolic encapsulation experiments inside liposomes, referred to here as Cells. Cells expressing deGFP with the CP/CK module were prepared using the emulsion transfer method, described below. Cell assembly requires three key components: a lipid–oil mixture to form the membrane, an inner solution to support protein synthesis, and an outer solution that maintains osmolarity and prevents the cells from bursting or shrinking.
Lipid-Oil Mixture
The membrane of the cell is composed of 1-palmitoyl-2-oleoyl-sn-glycero-3-phosphocholine (POPC), plant cholesterol (Chol), and 1,2-dioleoyl-sn-glycero-3-phosphoethanolamine-N-(lissamine rhodamine B sulfonyl) (Liss-Rhod PE). Liss-Rhod PE serves as a fluorescent label for the cell membrane, enabling imaging and tracking. A brief protocol for preparing the lipid–oil mixture is provided below; however, the mixture was prepared in advance to accommodate the required four-hour incubation period. Participants used the prepared lipid–oil mixture directly for cell preparation.
Add 1 mL mineral oil in the 1.8 mL small glass vial.
Add lipids shown in Table 4 into the glass vial on top of the mineral oil. The total intended lipid amount is 7.62 µmol.
Table 4:Lipid-Oil Mixture
| Lipid | Target Percentage (%) | Molecular Weight (g/mol) | Stock Concentration (mg/mL) | Volume to add (µL) |
|---|---|---|---|---|
| POPC | 70 | 760.76 | 25 | 162.17 |
| Chol | 29.95 | 386.654 | 50 | 17.65 |
| Liss-Rhod PE | 0.05 | 1301.71 | 1 | 4.96 |
Vortex the lipid-in-oil mixture for 10 seconds.
Place the glass vial in the bead-loaded hot bath at approximately 55 °C for 3-4 hours, shielding it from light with an aluminum foil cover. Do not use a lid, as the goal is to allow chloroform to evaporate from the lipids.
Place the vial (with lid) containing lipid-in-oil solution at RT for 10 min before using.
Inner Solution (Cytosol)
Cytosol serves as the inner solution for deGFP protein synthesis. Each participant assembled a 40 µL inner solution, the composition of which is shown in Table 5. Of this, 30 µL was used for encapsulation, and 10 µL was reserved for osmolarity check. In addition to the components of Cytosol, Optiprep was included as a density gradient medium to facilitate the inverted emulsion method for generating synthetic cells.
Table 5:Inner Solution Composition
| Component | Input Concentration | Final Concentration in Reaction | Volume to add [µL] |
|---|---|---|---|
| SMix | 3.33X | 1x | 12 |
| tRNA | 35 mg/mL | 3.5 mg/mL | 4 |
| PMix | 15 mg/mL | 1.8 mg/mL | 4.8 |
| Ribosomes | 10 µM | 1.8 µM | 7.2 |
| RNAse Inhibitor, Murine | 40,000 U/mL | 2000 U/mL | 2 |
pOpen-deGFP DNA template | 124 nM | 3 nM | 0.95 |
| Optiprep | 1.32 mg/µL | 0.043 mg/µL | 1.33 |
| Water | 7.72 | ||
| Total master mix volume [µL] | 40 |
Outer Solution (Glucose)
A 2 M glucose stock solution was prepared and filter-sterilized using a 0.22 µm filter. Based on the inner solution’s osmolarity (1400–1450 mOsm/kg), an 1140 mM glucose outer solution was prepared from the stock to closely match this value while remaining 100–150 mOsm/kg lower to minimize cell swelling or shrinkage. The measured osmolarity of the 1140 mM glucose solution was 1300 mOsm/kg.
Preparation of Liposomes
Once the lipid–oil mixture, inner solution, and outer solution were ready, participants prepared liposomes according to the following protocol:
Add 300 µL of outer solution to a 1.5 mL tube (Tube A).
Add 150 µL of lipid–oil mixture onto 30 µL of inner solution and washboard to form an emulsion.
Transfer the resulting milky emulsion onto the outer solution in Tube A.
Centrifuge Tube A at room temperature for 10 min at 9000 × g.
Remove the residual oil layer, leaving 100 µL of solution in Tube A.
Resuspend the liposome pellet by gentle pipetting and transfer the suspension to a 384-well glass bottom plate for imaging by microscopy.
Microscopy
Successful liposome preparations were imaged using a Cephla Squid+ microscope at 37 °C, and time-series data were collected to monitor deGFP expression. Representative images from seven independently prepared samples, each generated by a different participant, were acquired at the start of incubation and after 3 hours (Figure 14– Figure 20). Imaging used two channels: 488 nm for deGFP and 561 nm for rhodamine.
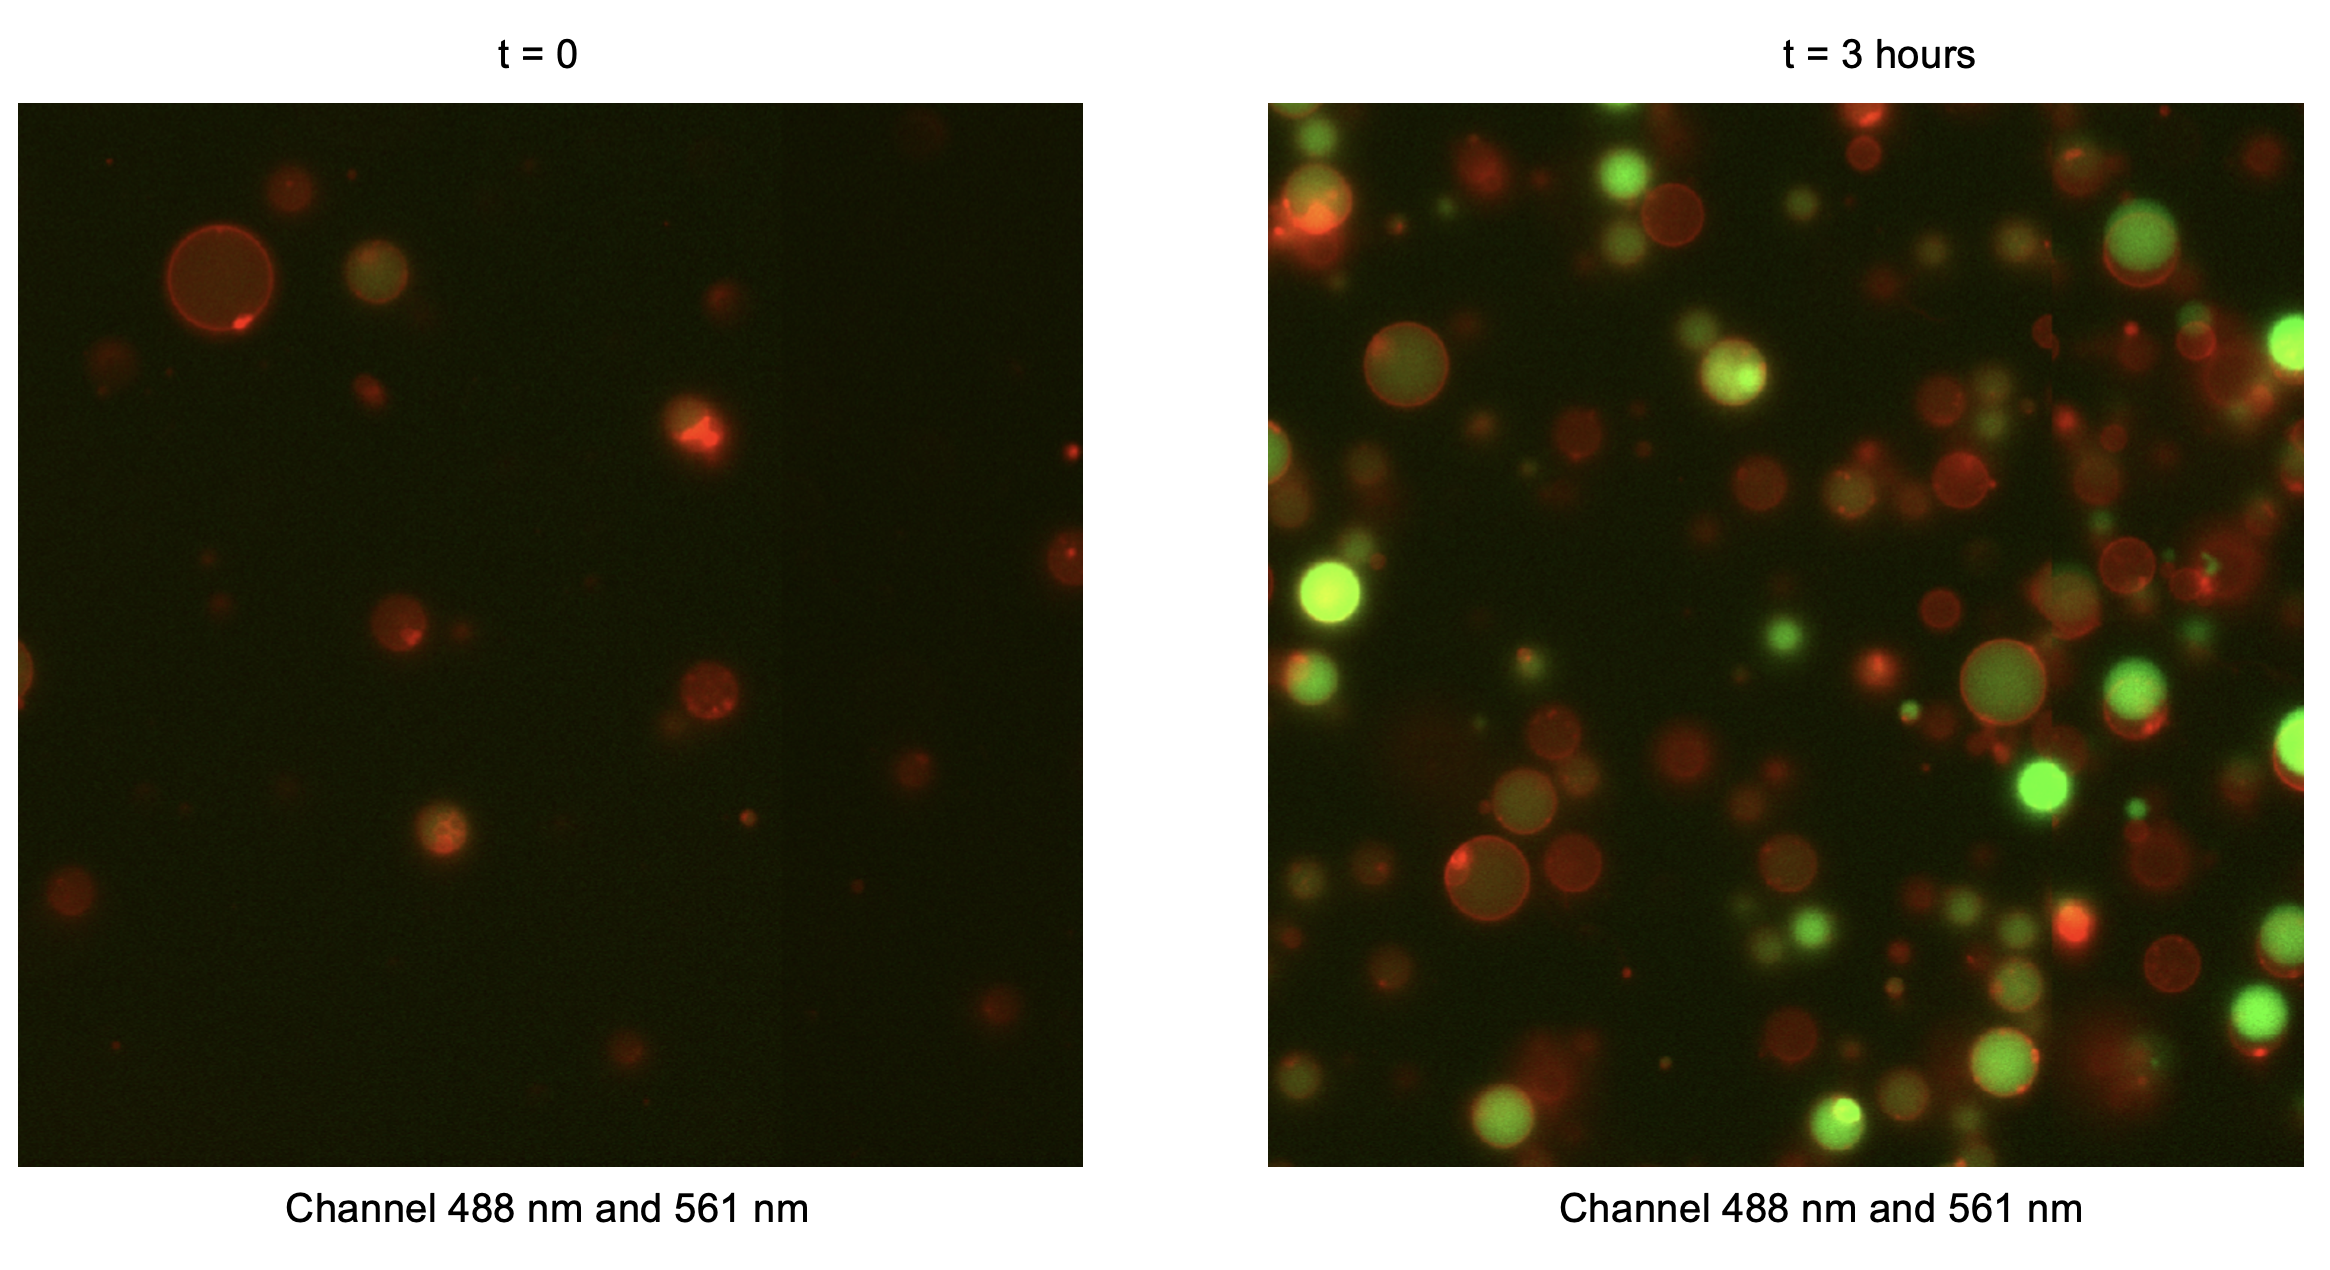
Figure 14:Combined green (488 nm) and red (561 nm) fluorescence channels. Timepoint 0 (t = 0) corresponds to 30 minutes after preparation of the inner solution, reflecting the time required to prepare liposomes.
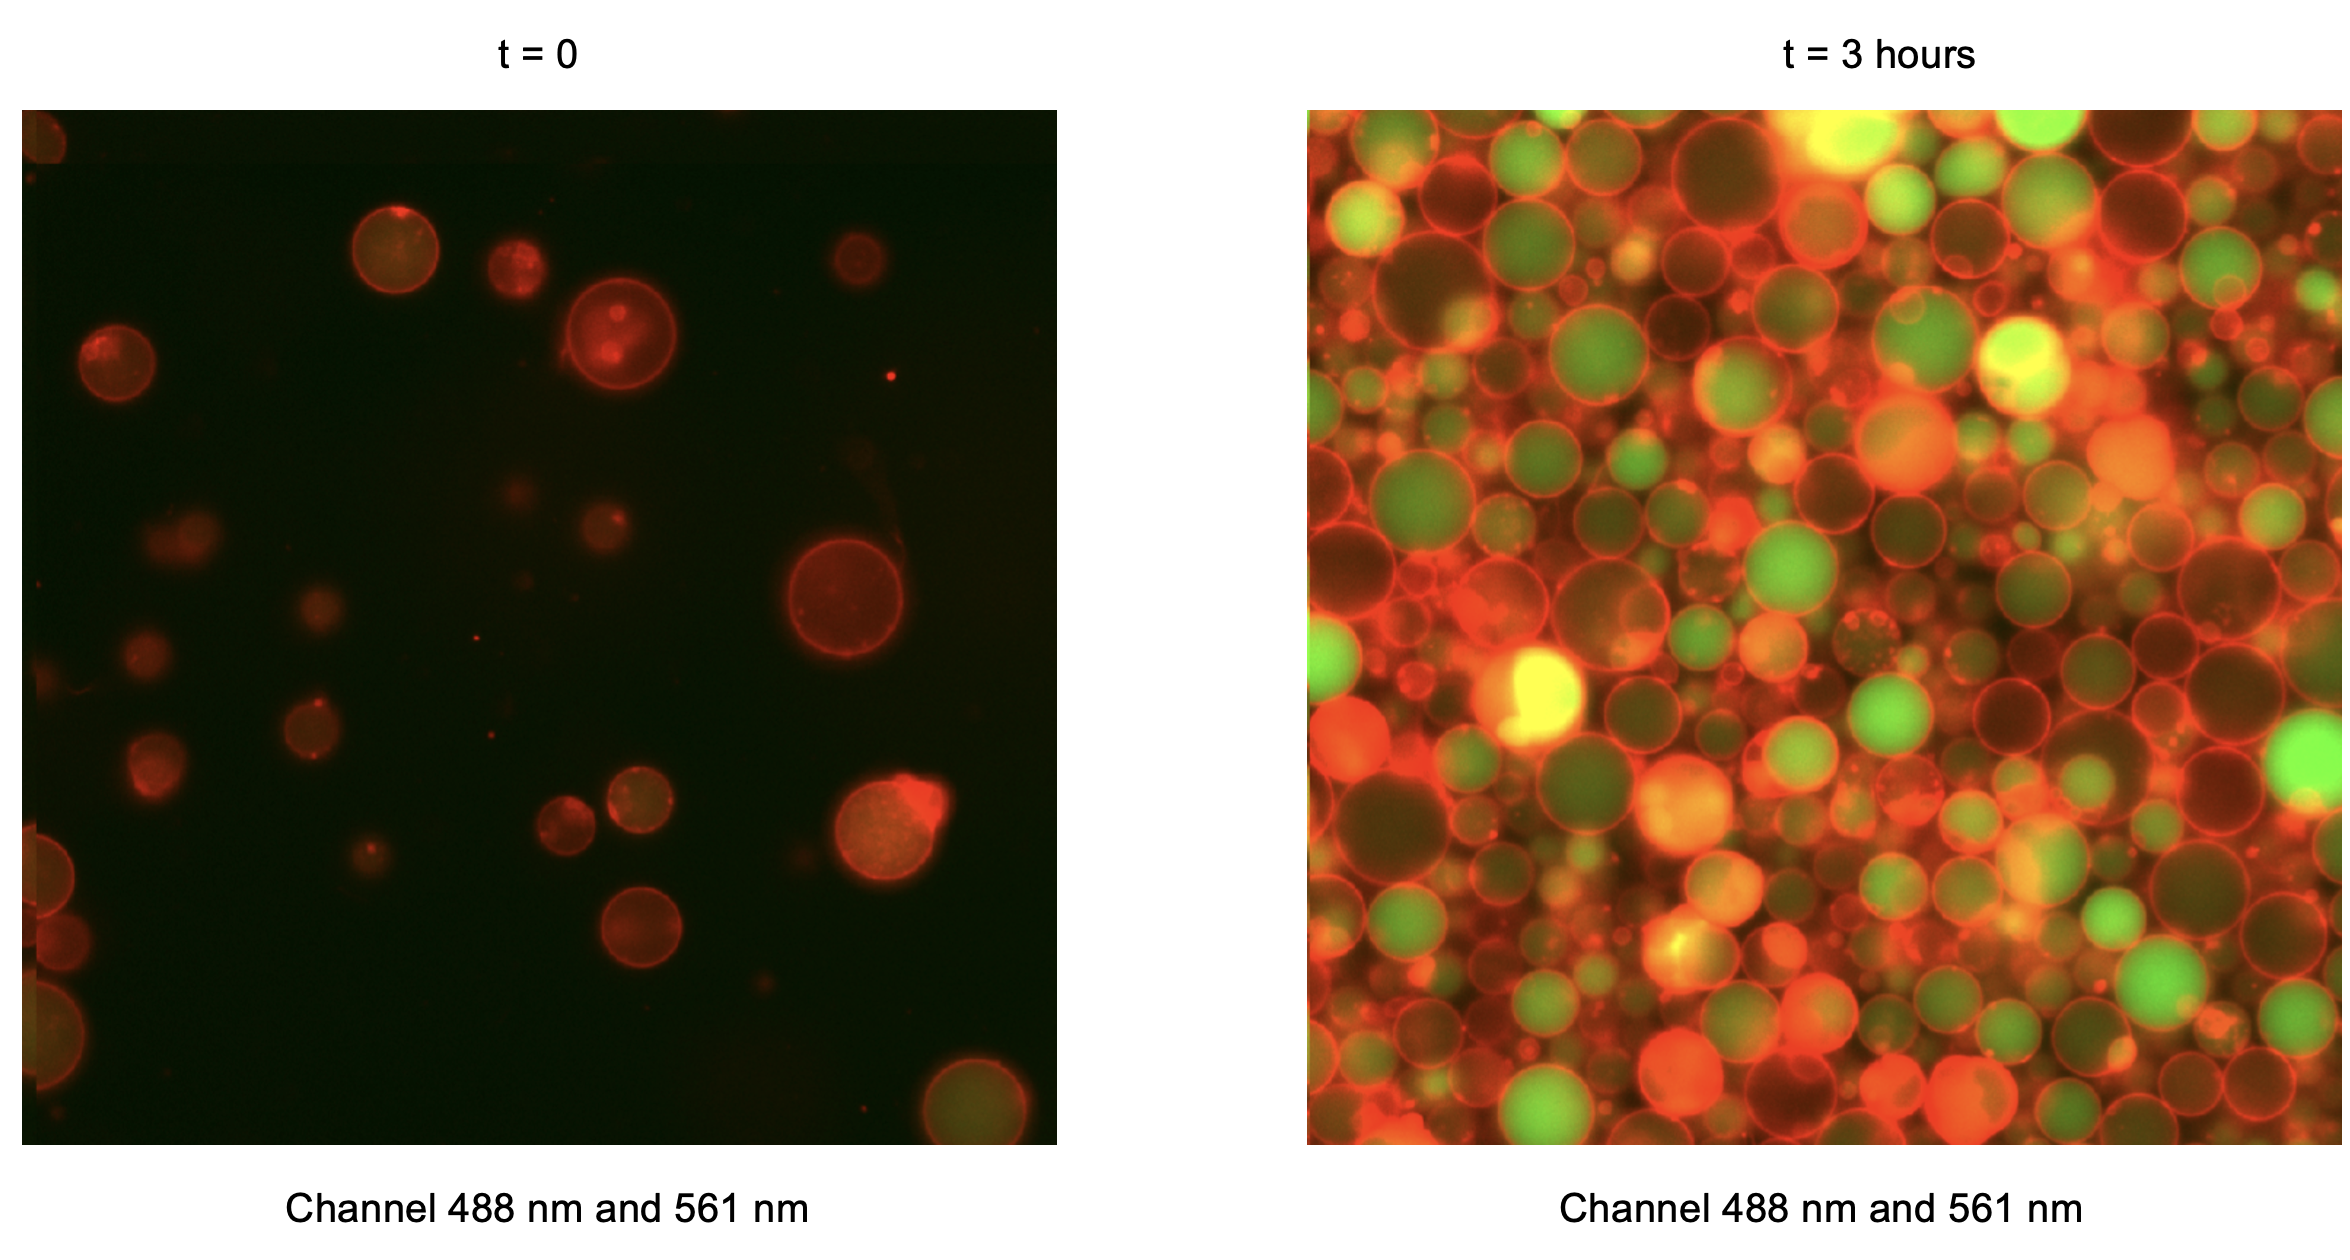
Figure 15:Combined green (488 nm) and red (561 nm) fluorescence channels. Timepoint 0 (t = 0) corresponds to 30 minutes after preparation of the inner solution, reflecting the time required to prepare liposomes.

Figure 16:Combined green (488 nm) and red (561 nm) fluorescence channels. Timepoint 0 (t = 0) corresponds to 30 minutes after preparation of the inner solution, reflecting the time required to prepare liposomes.

Figure 17:Combined green (488 nm) and red (561 nm) fluorescence channels. Timepoint 0 (t = 0) corresponds to 30 minutes after preparation of the inner solution, reflecting the time required to prepare liposomes.

Figure 18:Combined green (488 nm) and red (561 nm) fluorescence channels. Timepoint 0 (t = 0) corresponds to 30 minutes after preparation of the inner solution, reflecting the time required to prepare liposomes.

Figure 19:Combined green (488 nm) and red (561 nm) fluorescence channels. Timepoint 0 (t = 0) corresponds to 30 minutes after preparation of the inner solution, reflecting the time required to prepare liposomes.
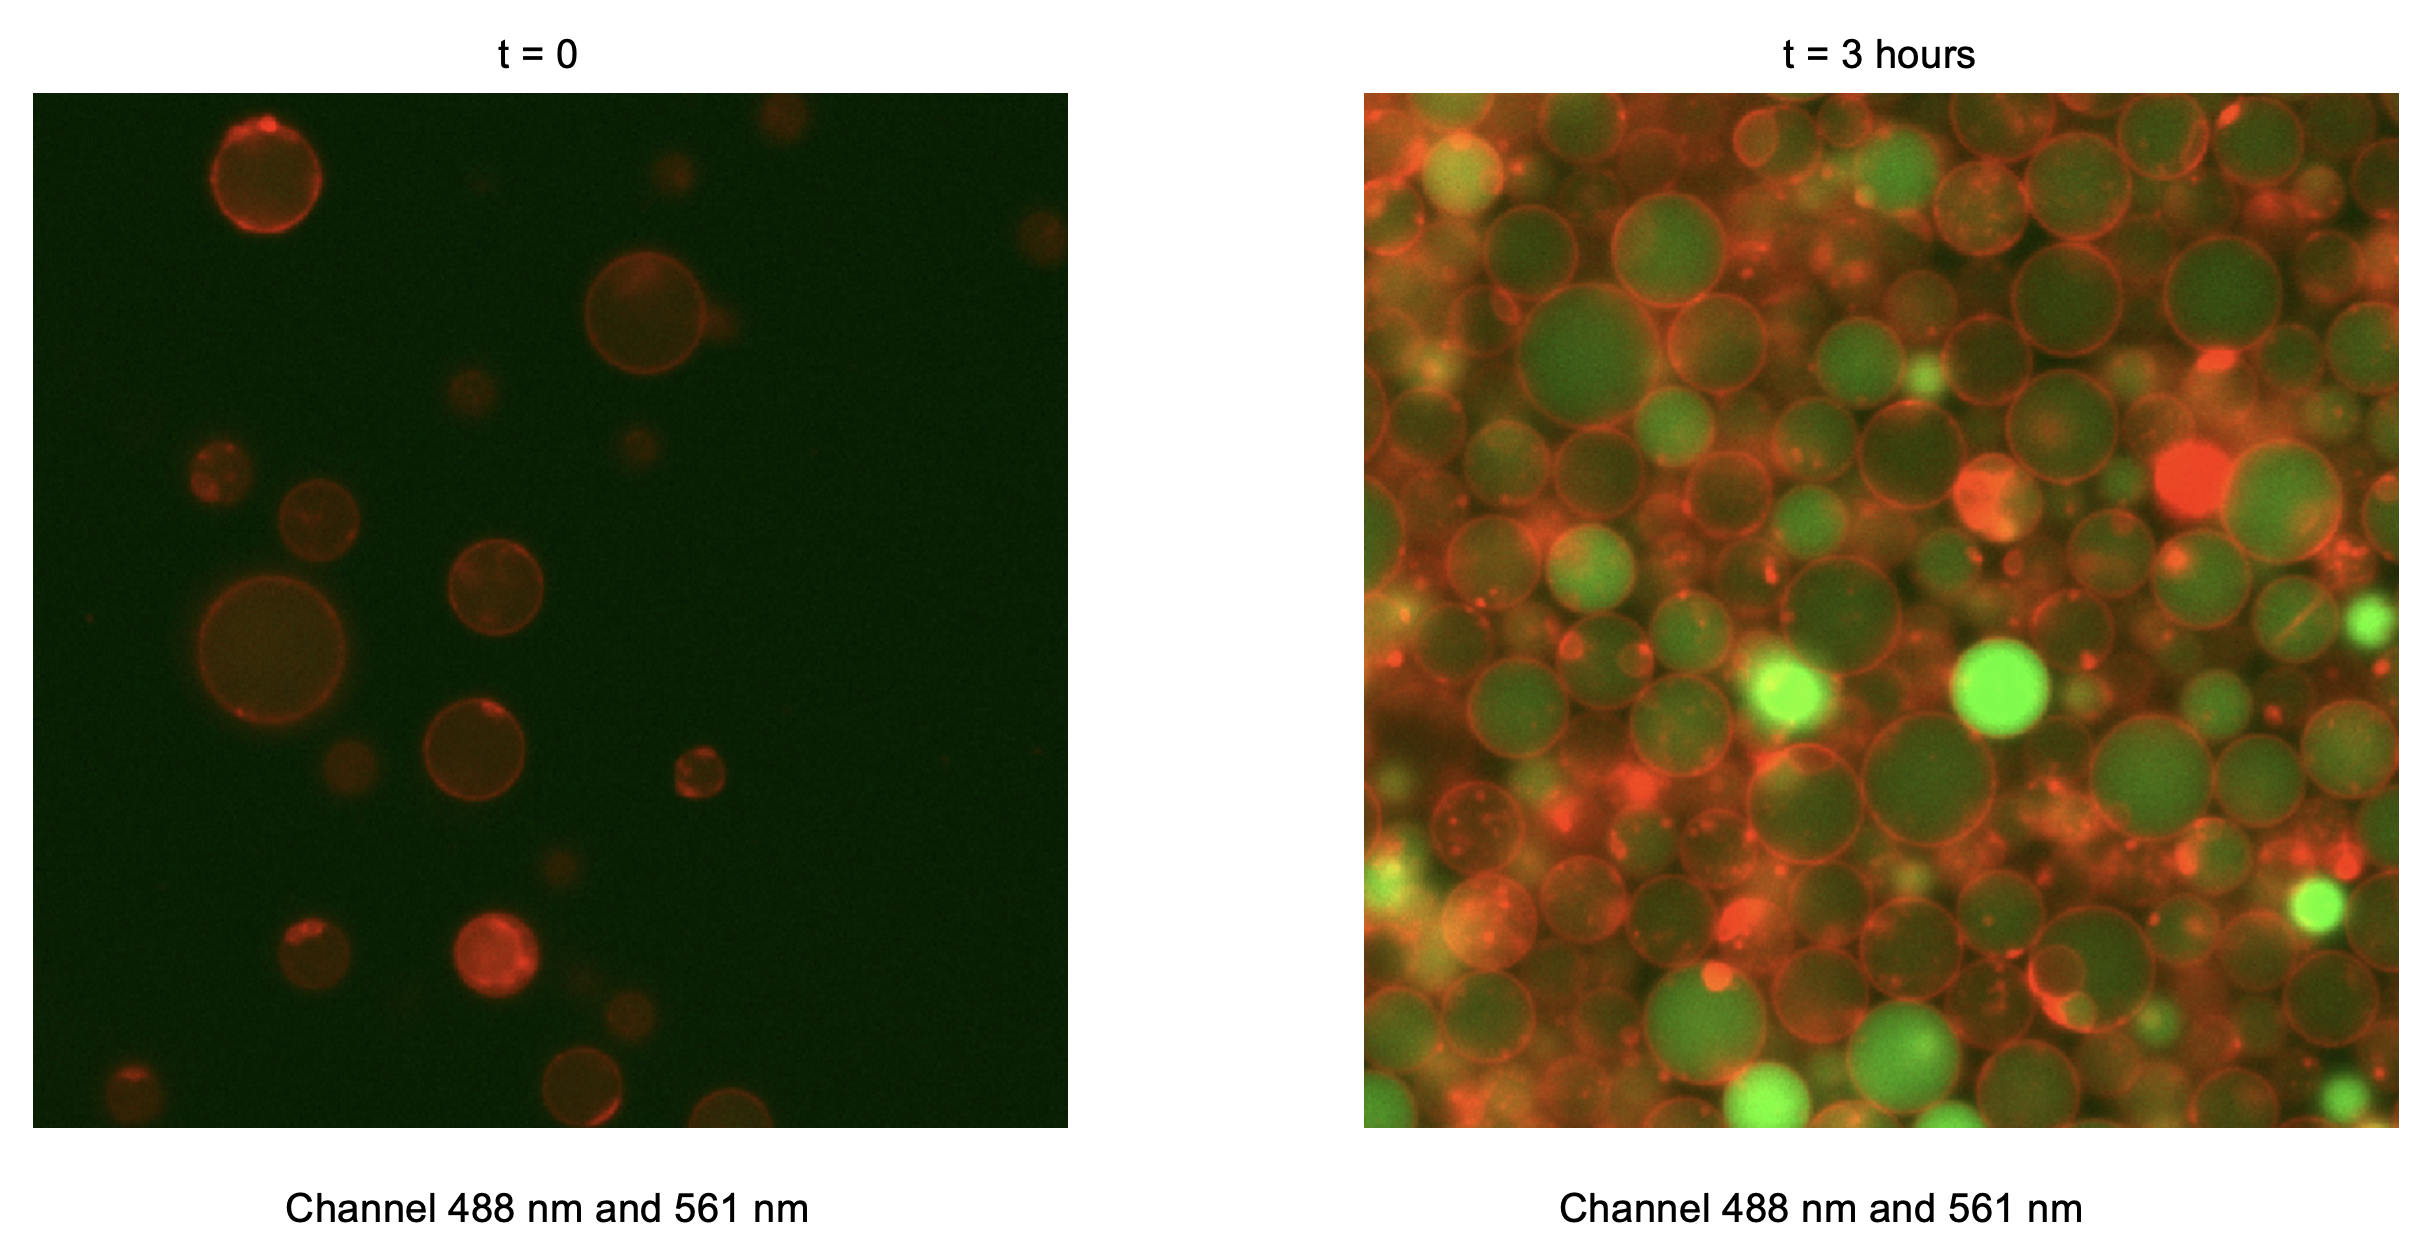
Figure 20:Combined green (488 nm) and red (561 nm) fluorescence channels. Timepoint 0 (t = 0) corresponds to 30 minutes after preparation of the inner solution, reflecting the time required to prepare liposomes.
Conclusion and Future Directions
The 2025 DevCells Kickoff Workshop provides a first model for bringing together highly interdisciplinary teams to build integrated synthetic cell technologies. Participants walked away with a shared language for cell building and were introduced to a set of tools to enable collaboration. The lessons learned from organizing this workshop will likely prove valuable for organizing future integrated cell building projects.
Participants
Chicago Node: Maddie Briggs (Kamat Lab, Northwestern University), Maram Naji (Lucks Lab, Northwestern University), Mary Kelly (Kamat Lab, Northwestern University), Matthew Lucia (Tullman-Ercek Lab, Northwestern University), Natalie Fisher (Chazot Lab, Northwestern University), Ojaswita Pant (Chazot Lab, Northwestern University), Samuel Chen (Liu Lab, University of Michigan).
London Node: Charlie Newell (Booth Lab, University College London), Ion Ioannou (Ces Lab, Imperial College London), Jonah McDonald (Hindley Lab, King’s College London), Julia Purrinos De Oliveira (Contini Lab, Imperial College London), Manuel Bibrowski (Elani Lab, Imperial College London), Niall McIntyre (Krishna Kumar Lab, Imperial College London).
San Luis Obispo Node: Javin Oza (Oza Lab, California Polytechnic State University, San Luis Obispo).
San Francisco Node: Anton Molina (Nucleus Labs, b.next), Anton Jackson-Smith (Nucleus Labs, b.next), Sharon Newman (Nucleus Labs, b.next), Surendra Yadav (Nucleus Labs, b.next), Yemo Ku (Nucleus Labs, b.next), YenYu Hsu (Nucleus Labs, b.next).
- CDK
- cell development kit
- Yadav, S. (2025). First Nucleus Cytosol Testing: Evaluation of Nucleus Cytosol v0.5 Through deGFP Expression. 10.63765/fppr8928