


BCECF Ratiometric pH Calibration
Estimate pH in myTXTL cell-free reactions from BCECF fluorescence.
BCECF is a ratiometric pH dye: its emission at 535 nm is excited at two
wavelengths (490 nm, 440 nm). The ratio of those reads (490/440) tracks pH
independently of absolute dye concentration.
This analysis uses the Nucleus CDK plate-reader pipeline:
Load the calibration plate (BCECF standards at known pH)
Compute the
490/440ratio and fit a standard curveLoad the kinetic data plate
Standardize fluorescence ratio to pH via the curve
Fit kinetics with a sigmoid + drift + baseline-offset model
Install note.
nucleus-cdkdeclarespyarrow>=18,<19, and pyarrow publishes no cp314 wheels, so a plainpip installfails on Python 3.14. Nothing incdkimports pyarrow, so we install with--no-deps; the packages the CDK actually uses come fromenvironment.yml.
!pip install --no-deps nucleus-cdk==0.6.0rc2

# Surface a failed install here, rather than as a confusing ModuleNotFoundError
# in the import cell below.
import importlib.metadata as md
assert md.version("nucleus-cdk") == "0.6.0rc2", f"got {md.version('nucleus-cdk')}"
print("nucleus-cdk", md.version("nucleus-cdk"))
Requirement already satisfied: nucleus-cdk==0.6.0rc2 in /opt/homebrew/anaconda3/lib/python3.12/site-packages (0.6.0rc2)
nucleus-cdk 0.6.0rc2
%load_ext autoreload
%autoreload 2

import pandas as pd

from cdk import logging
log = logging.setup_logging(logging.ERROR)

from cdk.instruments.platereader import load_platereader_data
The autoreload extension is already loaded. To reload it, use:
%reload_ext autoreload
1. Load calibration data
Gen5-exported endpoint data paired with a platemap. The platemap specifies the
pH of each standard in a pH column, and marks the standard wells with
Name == "BCECF standard".
cal = load_platereader_data(
    data_file="2026_3_10 BCECF pH measurement Calibration.xlsx",
    platemap_file="2026_3_10 BCECF pH measurement Calibration Platemap.csv",
    platereader="biotek",
)
print(cal)
PlateReaderResult with the following 1 blocks:
0: (24, 35) endpoint read with reads: 440,535 (Fluorescence), 490,535 (Fluorescence) (Plate 'Plate 5')
INFO Parsing plate block 1 biotek.py:190
INFO Read metadata section, found 1 read biotek.py:276
block(s).
WARNING Failed to parse the data grid: biotek.py:1430
Duplicate names are not allowed.
WARNING Parsed data grid did not contain any biotek.py:334
data.
WARNING Failed to parse the data grid: biotek.py:1430
Duplicate names are not allowed.
WARNING Parsed data grid did not contain any biotek.py:334
data.
WARNING Failed to parse the data grid: biotek.py:1430
Duplicate names are not allowed.
WARNING Parsed data grid did not contain any biotek.py:334
data.
INFO Parsed 1 segment(s) successfully. biotek.py:406
INFO Found 0 segment(s) that could not be biotek.py:407
associated with existing read data.
PlateReaderResult with the following 1 blocks:
0: (24, 35) endpoint read with reads: 440,535 (Fluorescence), 490,535 (Fluorescence) (Plate 'Plate 5')
# Take the block we want for further analysis
calibration_data = cal[0]2. Calibration curve
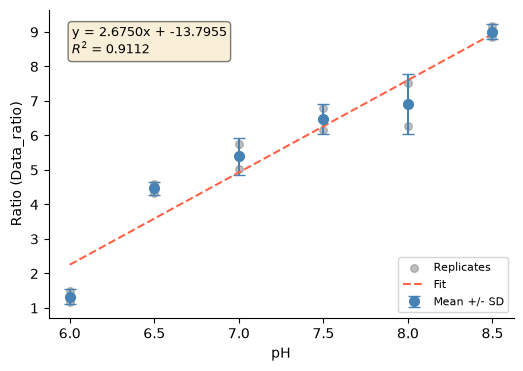
Compute the BCECF ratio (490,535 / 440,535) and fit a standard curve over the
"BCECF standard" wells — a linear regression of pH against 490/440 ratio.
cal_ratio = calibration_data.ratio("490,535", "440,535")
curve = cal_ratio.fit_standard_curve(known="pH", standard_name="BCECF standard")
curve.plot()
print("slope, intercept =", curve.result.params)
print("R^2 =", round(curve.result.r_squared, 4))slope, intercept = [ 2.67495596 -13.79554277]
R^2 = 0.9112
3. Load kinetic data
The 24 h kinetic run. The export contains the 440 and 490 kinetic blocks we
want plus a summary block we don’t, so we select just the kinetic blocks.
sample_result = load_platereader_data(
data_file="2026_3_25-bcecf-measurement-data.xlsx",
platemap_file="2026_3_25-bcecf-measurement-platemap.csv",
platereader="biotek",
)
print(sample_result)PlateReaderResult with the following 2 blocks:
0: (2790, 38) kinetic read with reads: 440,535 (Fluorescence) (Plate 'Plate 1')
1: (2790, 38) kinetic read with reads: 490,535 (Fluorescence) (Plate 'Plate 1')
INFO Parsing plate block 1 biotek.py:190
                    INFO     Read metadata section, found 1 read   biotek.py:276
                             block(s).
WARNING Failed to parse the data grid: Error biotek.py:1430
tokenizing data. C error: Expected
14 fields in line 4, saw 33
                    WARNING  Parsed data grid did not contain any  biotek.py:334
                             data.
INFO Parsed 2 segment(s) successfully. biotek.py:406
                    INFO     Found 0 segment(s) that could not be  biotek.py:407
                             associated with existing read data.
PlateReaderResult with the following 2 blocks:
0: (2790, 38) kinetic read with reads: 440,535 (Fluorescence) (Plate 'Plate 1')
1: (2790, 38) kinetic read with reads: 490,535 (Fluorescence) (Plate 'Plate 1')
sample_data = sample_result.take("kinetic")4. Convert to pH and fit kinetics
Compute the 490/440 ratio on the data plate, then standardize(curve) to
estimate pH from that ratio.
pH traces sit on a non-zero baseline (~6–8), so we fit sigmoid_drift_offset —
a sigmoid with a linear drift term and a fitted constant baseline c. The
plain sigmoid_drift model has no constant term and would mis-estimate both
steady state and maximum velocity on a pH trace.
pH = sample_data.ratio("490,535", "440,535").standardize(curve)
kinetics = pH.fit_kinetics(fit_function_name="sigmoid_drift_offset")
kinetics.summarykinetics.plot() overlays each fit on its data. Facet on "Well" to get one
fit per trace, matching the original analysis: the fit itself is always per-well,
but the default facet (Name) averages the fit parameters across the three
replicate wells and draws a single dashed line per condition.
Each panel shows the calculated pH trace (points), the model fit (dashed), the maximum-velocity tangent, and the steady-state and completion markers.
kinetics.plot(col="Well")<seaborn.axisgrid.FacetGrid at 0x1645916d0>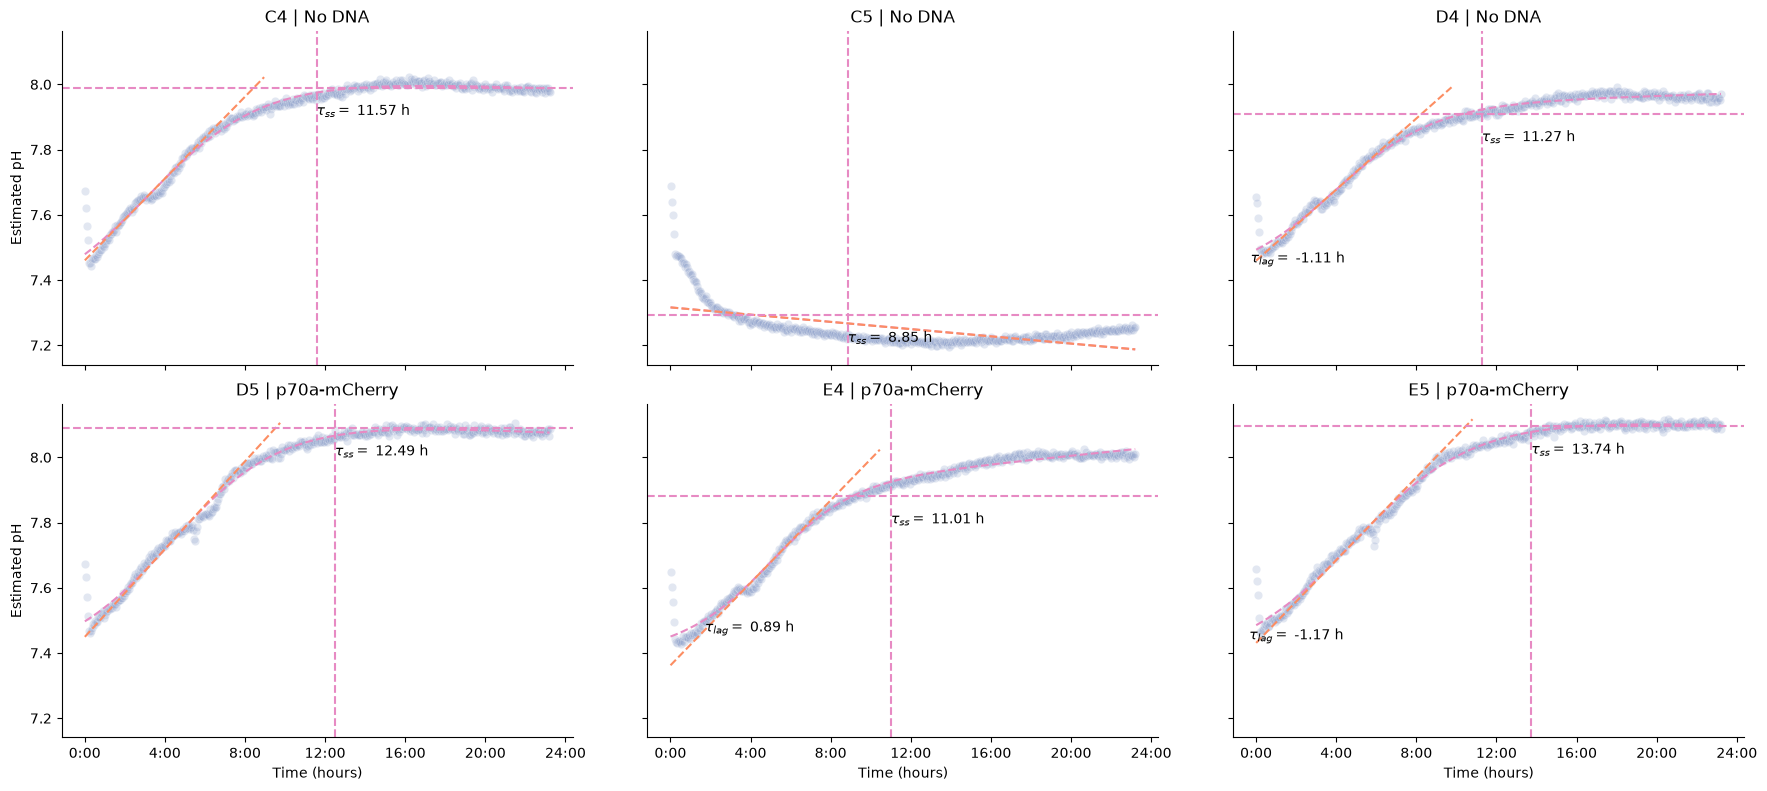
Interpreting the kinetics
The fit is in pH units, so the derived metrics read directly as pH:
Max Velocity — peak rate of acidification/alkalinization, in pH per hour.
Lag Time — time before the response takes off.
Steady State — the plateau pH. Because
sigmoid_drift_offsetfits a baselinec, this sits on the real pH baseline rather than near zero.Completion Time — when the response reaches its completion threshold.
R² / Good Fit — fit quality; inspect wells flagged
Good Fit == False.
Note that well C5 does not fit (Good Fit == False); its trace is effectively
flat, so the sigmoid model has no transition to fit.
kinetics.plot_response(x="Max Velocity", y="Steady State", hue="Name")<seaborn.axisgrid.FacetGrid at 0x167545090>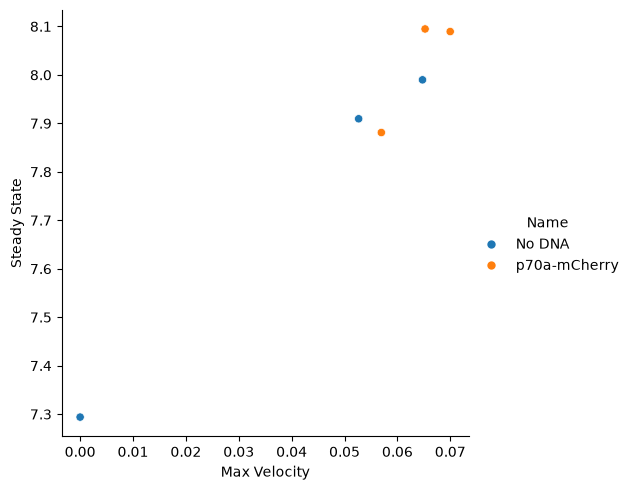
- CDK
- cell development kit