


BCECF pH Sensor
Abstract
Originally introduced by Roger Tsien and co-workers in 1982 as the premier ratiometric indicator for intracellular pH, the small molecule BCECF has been successfully adapted here to monitor extracellular cell-free microenvironments. In this work, we utilize its ideal physiological (~7.0) to achieve continuous, 24-hour kinetic tracking of metabolic acidification within dynamic myTXTL reactions. By optimizing this continuous kinetic workflow, we bridge historical fluorophore chemistry with modern automation to offer a standardized, high-precision pH measurement platform for the cell-free community.
Overview
We use the small molecule sensor BCECF (Figure 1) to measure pH in the myTXTL cell-free transcription-translation system. The ratiometric fluorescent probe BCECF is widely employed for monitoring internal pH due to its pKa of approximately 7.0, which ensures high sensitivity within the physiological range. By determining the ratio of fluorescence emission at 535 nm from dual excitation at 490 nm and 440 nm, the pH can be measured independently of the absolute fluorescence intensity.
The ratiometric fluorescent probe BCECF is widely employed for monitoring internal pH due to its pKa of approximately 7.0, which ensures high sensitivity within the physiological range [1, 2, 3]. Specifically, this ratiometric assay exploits the pH-dependent spectral shifts of the BCECF molecule. Excitation at 490 nm targets the base form of the dye, displaying a high fluorescence intensity that increases as pH rises. Conversely, excitation at 440 nm corresponds to the isosbestic point, where the fluorescence intensity remains unaffected by hydrogen ion concentration.
By calculating the ratio of emission intensities (I₄₉₀/I₄₄₀), we obtain a normalized value that is directly proportional to the pH of the system. This ratio is then converted into absolute pH values using an in situ calibration curve, typically established via a nigericin-based potassium buffer system or standard pH-titrated cell-free matrices.

Figure 1:The pH-sensitive molecule 2’,7’-bis-(2-carboxyethyl)-5-(and-6)-carboxyfluorescein acetoxymethyl ester (BCECF).
Reagents
| Name | Product | Manufacturer | Storage Conditions | Link |
|---|---|---|---|---|
| BCECF | BCECF, AM (2’,7’-Bis-(2-Carboxyethyl)-5-(and-6)-Carboxyfluorescein, Acetoxymethyl Ester) | ThermoFisher (B1150) | -5C to -30C | link |
| myTXTL | myTXTL Pro Cell-Free Expression Kit | Arbor Biosciences (540300) | -85C to -75C | link |
| plates | 96 well-plates flat V-bottom | NEST (701211) | RT | link |
| plate Mats | 96 well-plates Cap Mats | Thermo Fisher (276000) | — | link |
| pH test strips | — | Sigma (1095350001) | — | link |
Protocol
Reagent Preparation
Stock Solution: Resuspend the BCECF powder in 18.2 MΩ water to a final concentration of 10 mM.
Working Solution: Dilute the stock solution in 18.2 MΩ water to reach a 100 µM concentration.
Storage: Store both solutions at 4°C, protected from light.
Prepare Calibration curve
The Calibration curve is made by preparing solutions of myTXTL at different pH (6, 7, 8, 9) with 10 µM of BCECF.
Thaw one tube of myTXTL on ice.
The pH of myTXTL is around pH 8. Adjust the pH with either KOH or acetic acid. Because the reaction volume is very low, pH strips are recommended to measure the pH of the myTXTL solution.
Add the 100 µM BCECF solution to reach a final concentration of 10 µM.
Add 18.2 MΩ water to complete the volume to 100%.
Proceed to Plate Loading and Measurement.
Sample Preparation (myTXTL Mix)
Thaw one tube of myTXTL on ice.
Add the DNA template to reach a final concentration of 5 nM.
Adjust the volume with 18.2 MΩ water to reach 90% of the target final volume.
Add the 100 µM BCECF solution to reach a final concentration of 10 µM (completing the remaining 10% of the volume).
Mixing: Mix gently by pipetting up and down.
Once the BCECF and myTXTL are mixed, incubate the solution at 4°C for 10 minutes before loading it onto the plate.
Centrifugation: Briefly spin down the tube to collect the mixture and remove air bubbles.
Recover 20 µL of the reaction mixture to manually measure the pH with indicator strips at key milestones, specifically at t0, 4 hours, and overnight, to independently validate the kinetic curve.
Plate Loading and Measurement
Dispense 2 µL of the mixture per well into a 96-well plate.
Place the plate into the Neo2 plate reader.
Kinetics Settings: Run a 24-hour kinetic assay with measurements every 3 minutes at gain 40, bottom read.
Fluorescence Parameters: Perform ratiometric imaging using the following excitation/emission pairs:
440 nm / 520 nm
490 nm / 520 nm
Perform the ratiometric analysis as described below:
Dual excitation: Excite the sample sequentially at 490 nm (pH-sensitive) and 440 nm (pH-insensitive isosbestic point).
Single emission: Measure the fluorescence emission intensity at 535 nm for both excitation wavelengths.
Ratio calculation: Divide the emission intensity at 490 nm by the emission intensity at 440 nm.
Calibration: Convert the resulting ratio to absolute pH values using a standard calibration curve obtained with pH-calibrated myTXTL reactions.
Data Analysis
Process the raw fluorescence data by calculating the ratio of the two signals.
Convert the ratio values into pH measurements using a pre-established calibration curve.
Results
The sensor is first calibrated (Figure 2). This calibration curve allows us to measure the pH of the myTXTL system over time (Figure 3).
slope, intercept = [  2.67495596 -13.79554277]
R^2 = 0.9112
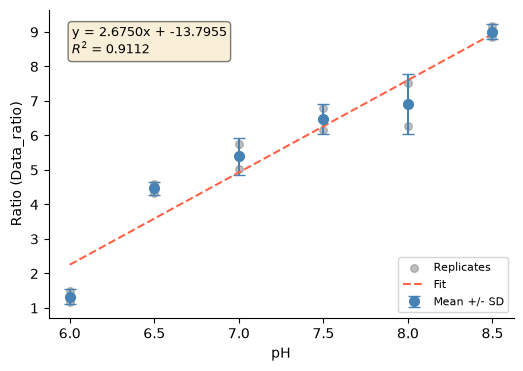
Figure 2:In situ pH calibration curve for BCECF in the myTXTL cell-free system. The fluorescence emission ratio (I₄₉₀/I₄₄₀) at 535 nm is plotted as a function of pH across a standard range (e.g., pH 6.0 to 8.0). Standard calibration samples were prepared by buffering the myTXTL cell-free system to known pH values. Data points represent the mean ± standard deviation (SD) of triplicate measurements. The solid line represents a mathematical fit used to convert experimental fluorescence ratios into absolute pH values.
<seaborn.axisgrid.FacetGrid at 0x1645916d0>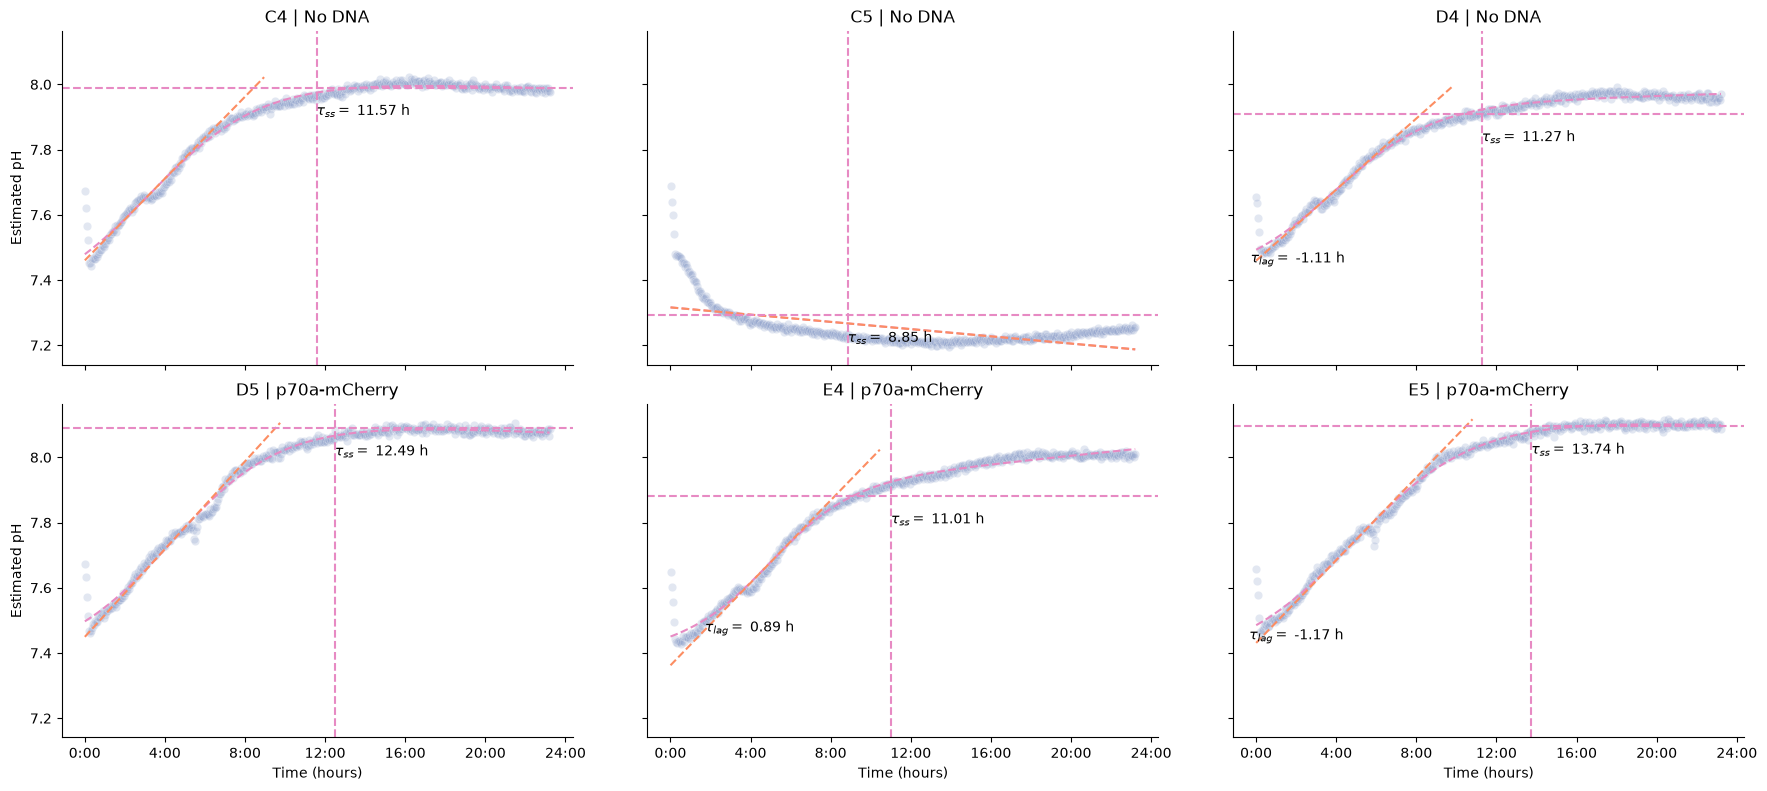
Figure 3:pH over time for myTXTL reactions performed in triplicate, either with (D5, E4, E5; bottom) or without (C4, C5, D4; top) 5 nM template DNA. Dots represent calculated pH values per well vs time. Dashed curves represent model fit (sigmoid with drift and baseline offset) to these data. Dashed lines included to help visualize time to steady state (vertical), signal at steady state (horizontal), and maximum reaction rate (diagonal).
Tips and Tricks
Keep the BCECF solution at 4°C and protected from the light when you use it.
BCECF may precipitate during storage. Gently warm the tube between your hands to fully resuspend the solution before pipetting.
After mixing, inspect the tube closely to ensure no precipitate remains. The solution should appear completely clear and slightly yellow.
We tested multiple plate geometries, including round-bottom and flat-bottom designs. Only V-bottom plates provided successful, reliable results. Please take this into consideration when ordering your consumables.
Mix gently by pipetting to avoid the formation of air bubbles.
Ensure the plate is sealed tightly and correctly; evaporation can occur over long kinetic runs, which will skew the final results.
If signal issues arise, begin troubleshooting by verifying the BCECF concentration. Run a preliminary validation test using well-characterized, standard reference buffers across the target pH range.
Ensure the BCECF solutions are split into small aliquots prior to storage.
If expressing a reporter protein, ensure its excitation and emission spectra do not overlap with BCECF; for example, mCherry is an ideal candidate.
Ensure that the BCECF at this specific working concentration is non-toxic and does not inhibit the overall yield of your cell-free expression (CFE) system.
Dispense the 2 µL droplets as close to the center of the well bottom as possible to ensure optimal optical alignment and reproducible fluorescence readings.
Carefully inspect the wells after the overnight incubation to ensure no liquid evaporation has occurred, as volume loss will invalidate the results.
Expected behavior
The final myTXTL-BCECF mixture must remain completely clear throughout the assay.
The 100 µM BCECF working solution should exhibit a distinct yellow color.
You should expect a strong, stable fluorescent signal with no significant background noise or unexpected fluctuations throughout the kinetic assay.
The calculated pH values obtained with BCECF must closely coincide with independent measurements from pH indicator strips.
Technical replicates across the 96-well plate should exhibit minimal variance, yielding tightly overlapping kinetic traces with low standard deviations.
Due to the heavy buffering capacity of the myTXTL system, the resulting kinetic curve should remain relatively flat over time.
An evaporation loss of up to 10% is expected; if the volume loss exceeds this threshold, exclude the affected well from your analysis.