


Testing Integration of a TetR Biosensor with a Toehold Exchange Riboregulator in Developer Cells with Nucleus Cytosol
This DevNote presents preliminary results from the 2026 CSHL Synthetic Biology Summer Course. It is not a complete peer-reviewed research output. These opinions, recommendations, findings, and conclusions do not necessarily reflect the views or policies of NIST or the United States Government. Certain equipment, instruments, software, or materials are identified in this paper in order to specify the experimental procedure adequately. Such identification is not intended to imply recommendation or endorsement of any product or service by NIST, nor is it intended to imply that the materials or equipment identified are necessarily the best available for the purpose.
Overview
Through the 2026 CSHL Synthetic Biology Summer Course, the students, instructors, and teaching assistants helped optimize an anhyrotetracycline (aTc) sensor, which uses a toehold exchange (THE) riboregulator RNA circuit derepressed in the presence of aTc via the TetR transcription factor. This aTc sensor was first optimized in bulk cell-free expression reactions using PURExpress. The unregulated toehold exchange riboregulator circuit and the full aTc sensing circuit were then tested in Developer Cells (DevCells), an encapsulated cell-free expression system.
Bill of Materials
Table 1:Reagents and materials
| Reagent | Product Name | Manufacturer | Catalog No. | Price | Storage Conditions | Link |
|---|---|---|---|---|---|---|
| CPRG | Chlorophenol red-β-D-galactopyranoside | Roche | 10884308001 | $160 | -20 °C in water at 10 mg/mL | link |
| Cytosol (SMix, PMix, ribosomes, tRNA) | b.next | b.next | — | — | -80 °C | — |
| PURExpress | NEB PURExpress in vitro protein synthesis kit | New England Biolabs | E6800S | $307.00 | -80 °C | link |
| aTc | Anhydrotetracycline hydrochloride | Sigma-Aldrich | 37919-100MG-R | $275.00 | Room temp | link |
| RNase Inhibitor | RNase Inhibitor, Murine | New England Biolabs | M0314L | $347.00 | -20 °C | link |
| Lipid-in-Oil Kit | 16:0-18:1 PC (POPC) + Cholesterol + Cy5.5 | b.next | Composition in Table 5 | — | 4 °C | — |
| Optiprep | Optiprep | Serumwerk Bernburg | 1893 | — | Room temp | — |
| Glucose | D-(+)-Glucose, 99.5% | Sigma-Aldrich | G8270-1KG | — | Room temp | — |
| Nuclease-free water | Nuclease-free water | ThermoFisher Scientific | AM9916 | — | Room temp | — |
| 384-well glass bottom plates | 384-well glass bottom plate, 1.5 cover glass | Cellvis | P384-1.5H-N | $423.00 | Room temp | link |
| Optical Adhesive Film | MicroAmp Optical Adhesive Film | ThermoFisher Scientific | 4311971 | — | Room temp | — |
| Osmometer | Freezing-point osmometer | Advanced Micro-Osmometer | Model 3300 | — | Room temp | — |
| PCR tubes | Thin-walled, RNase-free PCR tubes | ThermoFisher Scientific | AM12225 | — | Room temp | — |
DNA templates and sequences
DNA templates for the full toehold exchange (THE) riboregulator transcription
(TX) unit. Bold sequences indicate promoters. Underlined sequences
indicate the regions amplified using the specified primers. Italic sequences
indicate terminators. Annotated sequence maps are available on
Benchling.
Sequence files in GenBank format are included in sequences/.
Table 2:Primers
| Name | Sequence (5’ to 3’) | Purpose |
|---|---|---|
| T7fwd | TTCTAATACGACTCACTATAGGGAG | Forward primer for T7 promoter (used in all PCRs except IN_1_TetR) |
| fwd_U1 | CATTACTCGCATCCATTCTCAGG | Forward primer for IN_1_TetR PCR |
| T7rev | CAAAAAACCCCTCAAGACCCGTTTAG | Reverse primer for T7t terminator (For Gate / riboregulator template PCRs) |
| rev_Ux | GGTGGAAGGGCTCGGAGTTG | Reverse primer for IN_1_TetR PCR |
| Thyb10rev | AAAAAAAAACAGATAGCCGCGCGAAC | Reverse primer for Thyb10 terminator (For Input template PCRs) |
Table 3:DNA templates
| Name | Sequence (5’ to 3’) | Purpose |
|---|---|---|
Io | gaagtctaacgctgctctgggctaactgtcCATTACTCGC | Non-complementary input; minimum expression (OFF). Plasmid map: Figure 1. |
IN_1 | gaagtctaacgctgctctgggctaactgtcCATTACTCGC | Complementary input with maximum translation rate; maximum expression (ON). Plasmid map: Figure 2. |
IN_1_TetR | CATTACTCGCATCCATTCTCAGGCTGTCTCGTCTCGTCTC | DNA template with the TetR operator sequence downstream of the T7 promoter. Plasmid map: Figure 3. |
G_1 sCFP3A | see Figure 4 | Toehold exchange riboregulator that controls cyan fluorescent protein (CFP) expression in response to IN_1 |
G_1 sfGFP | see Figure 5 | Toehold exchange riboregulator that controls green fluorescent protein (GFP) expression in response to IN_1 |
T7p_TetR | see Figure 6 | DNA template for T7-driven expression of TetR |
pOpen-deGFP | see pOpen-deGFP.gbk | DevCell encapsulation control plasmid. Module documentation: docs |
The full-length G_1 sCFP3A, G_1 sfGFP, and T7p_TetR sequences are long and are
provided verbatim as GenBank files in sequences/ rather than inline. Plasmid
maps for all six constructs are shown below.
Figure 1:Plasmid map of Io, the non-complementary input (OFF).
Figure 2:Plasmid map of IN_1, the complementary input (ON).
Figure 3:Plasmid map of IN_1_TetR, the TetR-regulated input.
Figure 4:Plasmid map of G_1 sCFP3A, the CFP-reporting gate.
Figure 5:Plasmid map of G_1 sfGFP, the GFP-reporting gate.
Figure 6:Plasmid map of T7p_TetR, the TetR expression template.
Design
The mechanistic details of how toehold exchange riboregulators work are
described in another DevNote:
devnotes
The mechanistic details of TetR repression of transcription and derepression
of transcription in response to aTc are described in the Nucleus
documentation:
docs
Key design notes for toehold exchange riboregulators are described in another
DevNote:
devnotes
The sequences for the toehold exchange riboregulators are based on those
discussed in the following publication:
biorxiv
The sequences were generated using the ctRSD and THE riboregulator sequence compiler:
Documentation: ctrsd
-simulator .readthedocs .io /en /latest /SeqCompiler .html Colab: colab
.research .google .com /drive /1Bd -ZugIWnc7PMiFkpaia _UnWA24KF3Mv
Protocol
Linear DNA templates for the circuit were prepared as described in a previous DevNote: devnotes
.nucleus .engineering /articles /ss -20260712. The protocol follows the CSHL Synthetic Biology 2026 - Nucleus Base Cell protocol: docs
.nucleus .engineering /docs /processes /build -base -cell /main. With respect to DevCell preparation, the protocol did not deviate from the Nucleus protocol, other than the outer solution osmolarity, which was 1050 mmol/kg here.
The Cytosol reaction setup table shows the concentrations and volumes used for each of the samples. The Membrane composition and Outer solution tables show the mixtures used to prepare the DevCells.
For DevCell experiments that included TetR, TetR was expressed in a bulk reaction of Nucleus Cytosol using 4 nM of linear
T7_TetRtemplate (Figure 6). The reaction was incubated at 37 °C for at least 3 h.This TetR-enriched cytosol was then mixed at a 1:4.56 volume ratio with fresh Nucleus Cytosol containing the circuit DNA templates, which was then encapsulated.
After encapsulation, a 50 µL volume of DevCells for each sample was transferred to a 384-well glass bottom plate (Table 1; see also the Nucleus materials reference). Each sample was sufficiently diluted to prevent overcrowding of DevCells in the imaging wells. After initial imaging, the samples were incubated at 37 °C for 1.5 h or 2 h in a benchtop incubator before the first post-incubation imaging.
After this first image, the samples were returned to the incubator and incubated at 37 °C for another 3 h before taking a final image.
Imaging was conducted on a Cephla Squid fluorescence microscope with a 20x air objective (Olympus).
Green fluorescent protein (GFP) was imaged at 488 nm excitation. The DevCell membranes, which were labeled with Cy5.5, were imaged at 638 nm excitation. The microscope camera has no emission filter, so emission was captured as the integration of all wavelengths. For both fluorescence channels, the exposure times and excitation laser intensities were kept constant across all conditions within each experiment. Specific exposure time varied between experiments, depending on excitation laser power, to provide sufficient contrast across all samples.
For each sample, the entire area of the well was captured with 25 non-overlapping images at each time point, and all images were used for analysis and quantification.
This microscope did not have onboard temperature control, which is why the DevCells were incubated in a benchtop incubator and imaged at only a few time points.
Automated image analysis of DevCell intensities was conducted using the Nucleus Cell Development Kit (nucleus-cdk), software developed by b.next for Nucleus.
Cytosol reaction setup table
The last four columns indicate the volumes of each reagent to add for the four different samples tested, for encapsulating cell-free reactions in DevCells. These samples are detailed in Figure 8.
Table 4:Cytosol reaction setup
| Component | Stock Concentration | Final Concentration | Negative Control Volume (µL) | Positive Control Volume (µL) | EXP OFF Volume (µL) | EXP ON Volume (µL) |
|---|---|---|---|---|---|---|
| SMix | 3.33x | 1.09x | 7.2 | 7.2 | 7.2 | 7.2 |
| PMix | 15 mg/mL | 0.95 mg/mL | 1.4 | 1.4 | 1.4 | 1.4 |
| Ribosomes | 10 µM | 0.36 µM | 0.8 | 0.8 | 0.8 | 0.8 |
| tRNA | 35 mg/mL | 3.5 mg/mL | 2.4 | 2.4 | 2.4 | 2.4 |
DNA template for Gate (G_1 GFP, Figure 5) | 100 nM | 2 nM | 0.44 | 0.44 | 0.44 | 0.44 |
DNA template for complementary input (IN_1, Figure 2, or IN_1_TetR, Figure 3) | 100 nM | 18 nM | 0 | 3.96 | 3.96 | 3.96 |
Non-complementary input DNA (Io, Figure 1) | 100 nM | 18 nM | 3.96 | 0 | 0 | 0 |
| TetR-enriched cytosol | 1x | 0.215x | 0 | 0 | 4.73 | 4.73 |
| RNase Inhibitor | 40 000 U/mL | 2000 U/mL | 1.4 | 1.4 | 1.4 | 1.4 |
| Opti-Prep | — | 3.6% | 0.8 | 0.8 | 0.8 | 0.8 |
| Water | — | — | 4.77 | 4.77 | 0 | 0 |
Membrane composition table
Table 5:Membrane composition
| Lipid | Target Percentage % | Molecular Weight | Concentration (mg/mL) | Volume to Add (µL) |
|---|---|---|---|---|
| 1-palmitoyl-2-oleoyl-sn-glycero-3-phosphocholine (POPC) | 70 | 760.076 | 25 | 162.17 |
| Cholesterol | 29.95 | 386.66 | 50 | 17.65 |
| Cy5.5 | 0.05 | 1366.32 | 1 | 4 |
Outer solution table
Table 6:Outer solution
| Component | Concentration |
|---|---|
| Glucose | 1050 mM (for Nucleus Cytosol) or 870 mM (for NEB PURExpress) |
Results and Observations
Building on a previous DevNote and bulk cell-free expression experiments (Piorino et al. 2025), we sought to test toehold exchange riboregulators (Piorino et al. 2025, Schaffter et al. 2025) and small molecule biosensors in DevCells. We first validated that the coupling of a TetR-based biosensor and the toehold exchange riboregulators worked in bulk cell-free expression (Figure 7). Due to constraints on the available fluorescence channels on the microscopes available at the course, we had to switch from CFP expression in bulk reactions to GFP expression in the DevCell reactions. Although we do not expect this change to dramatically change system behavior, a detailed comparison would be warranted in a future study. Figure 8 shows the schematics of the different systems we encapsulated in DevCells for testing. In DevCells, we initially tested the same concentrations of Input template and Gate template that we used in the bulk cell-free experiments, but we did not observe much difference in expression levels between positive and negative controls (Figure 9, Figure 10), which contained the unregulated toehold exchange riboregulator circuit (Figure 8). We hypothesized that this might be because we were using multiple templates and perhaps many of the DevCells did not contain high enough concentrations of both templates. Thus, we retried the experiment and increased the Input template concentration to 10-fold of the Gate template. In microscope images, there were clearly many bright DevCells in the positive control samples (Figure 11), suggesting that this optimized ratio worked better. However, image analysis that quantified the average intensity of the DevCells revealed little difference between the positive and negative controls. There was just a much higher fraction of highly fluorescent outliers in the positive control samples (Figure 12, Figure 13, Figure 14), which may suggest that only a small percentage of the DevCells received enough of both the Input and Gate templates to activate protein expression. In the experimental samples, in which TetR and aTc were included, we were unable to assess whether the system worked because aTc exhibited a strong fluorescence signal in the GFP channel (Figure 9, Figure 11, Figure 13).

Figure 7:Overview of system (A) and bulk plate reader results (B).
Experiments were conducted in PURExpress at 37 °C as described in the
following DevNote
with the following conditions: 2 nM of G_1 template (Figure 4), 4 nM
of IN_1 template (Figure 2) or Io template (Figure 1), and 4 nM of
TetR template (Figure 6). The plot shows
the mean CFP signal of three technical replicates, with the shaded regions
indicating the standard deviation of the mean.

Figure 8:Overview of different systems encapsulated and tested in DevCells. The
negative and positive controls used input templates (Io, Figure 1, or
IN_1, Figure 2) that did
not contain the TetR operator downstream of the T7 promoter and thus are
expected to have higher transcription rates for these inputs compared to the
input regulated with the TetR operator (IN_1_TetR, Figure 3) in the experimental
samples. The experimental samples were prepared by mixing TetR-enriched
cytosol, in which TetR had been expressed for 3 h before the start of the
experiment, with a freshly prepared cytosol mixture containing the RNA
circuit DNA templates. This mixture was then encapsulated. These
experimental samples thus had the same system encapsulated in the DevCells
and aTc was either added (EXP ON) or not added (EXP OFF) to the solution
surrounding the DevCells.

Figure 9:Representative images of GFP fluorescence in DevCells after cell-free expression at 37 °C. Here, the input-gate template ratio was 4 nM:2 nM. Contrast and brightness adjustments were uniformly applied across all images for GFP (green) and Cy5 membrane dye (red) fluorescence channels. Scale bar: 20 µm.
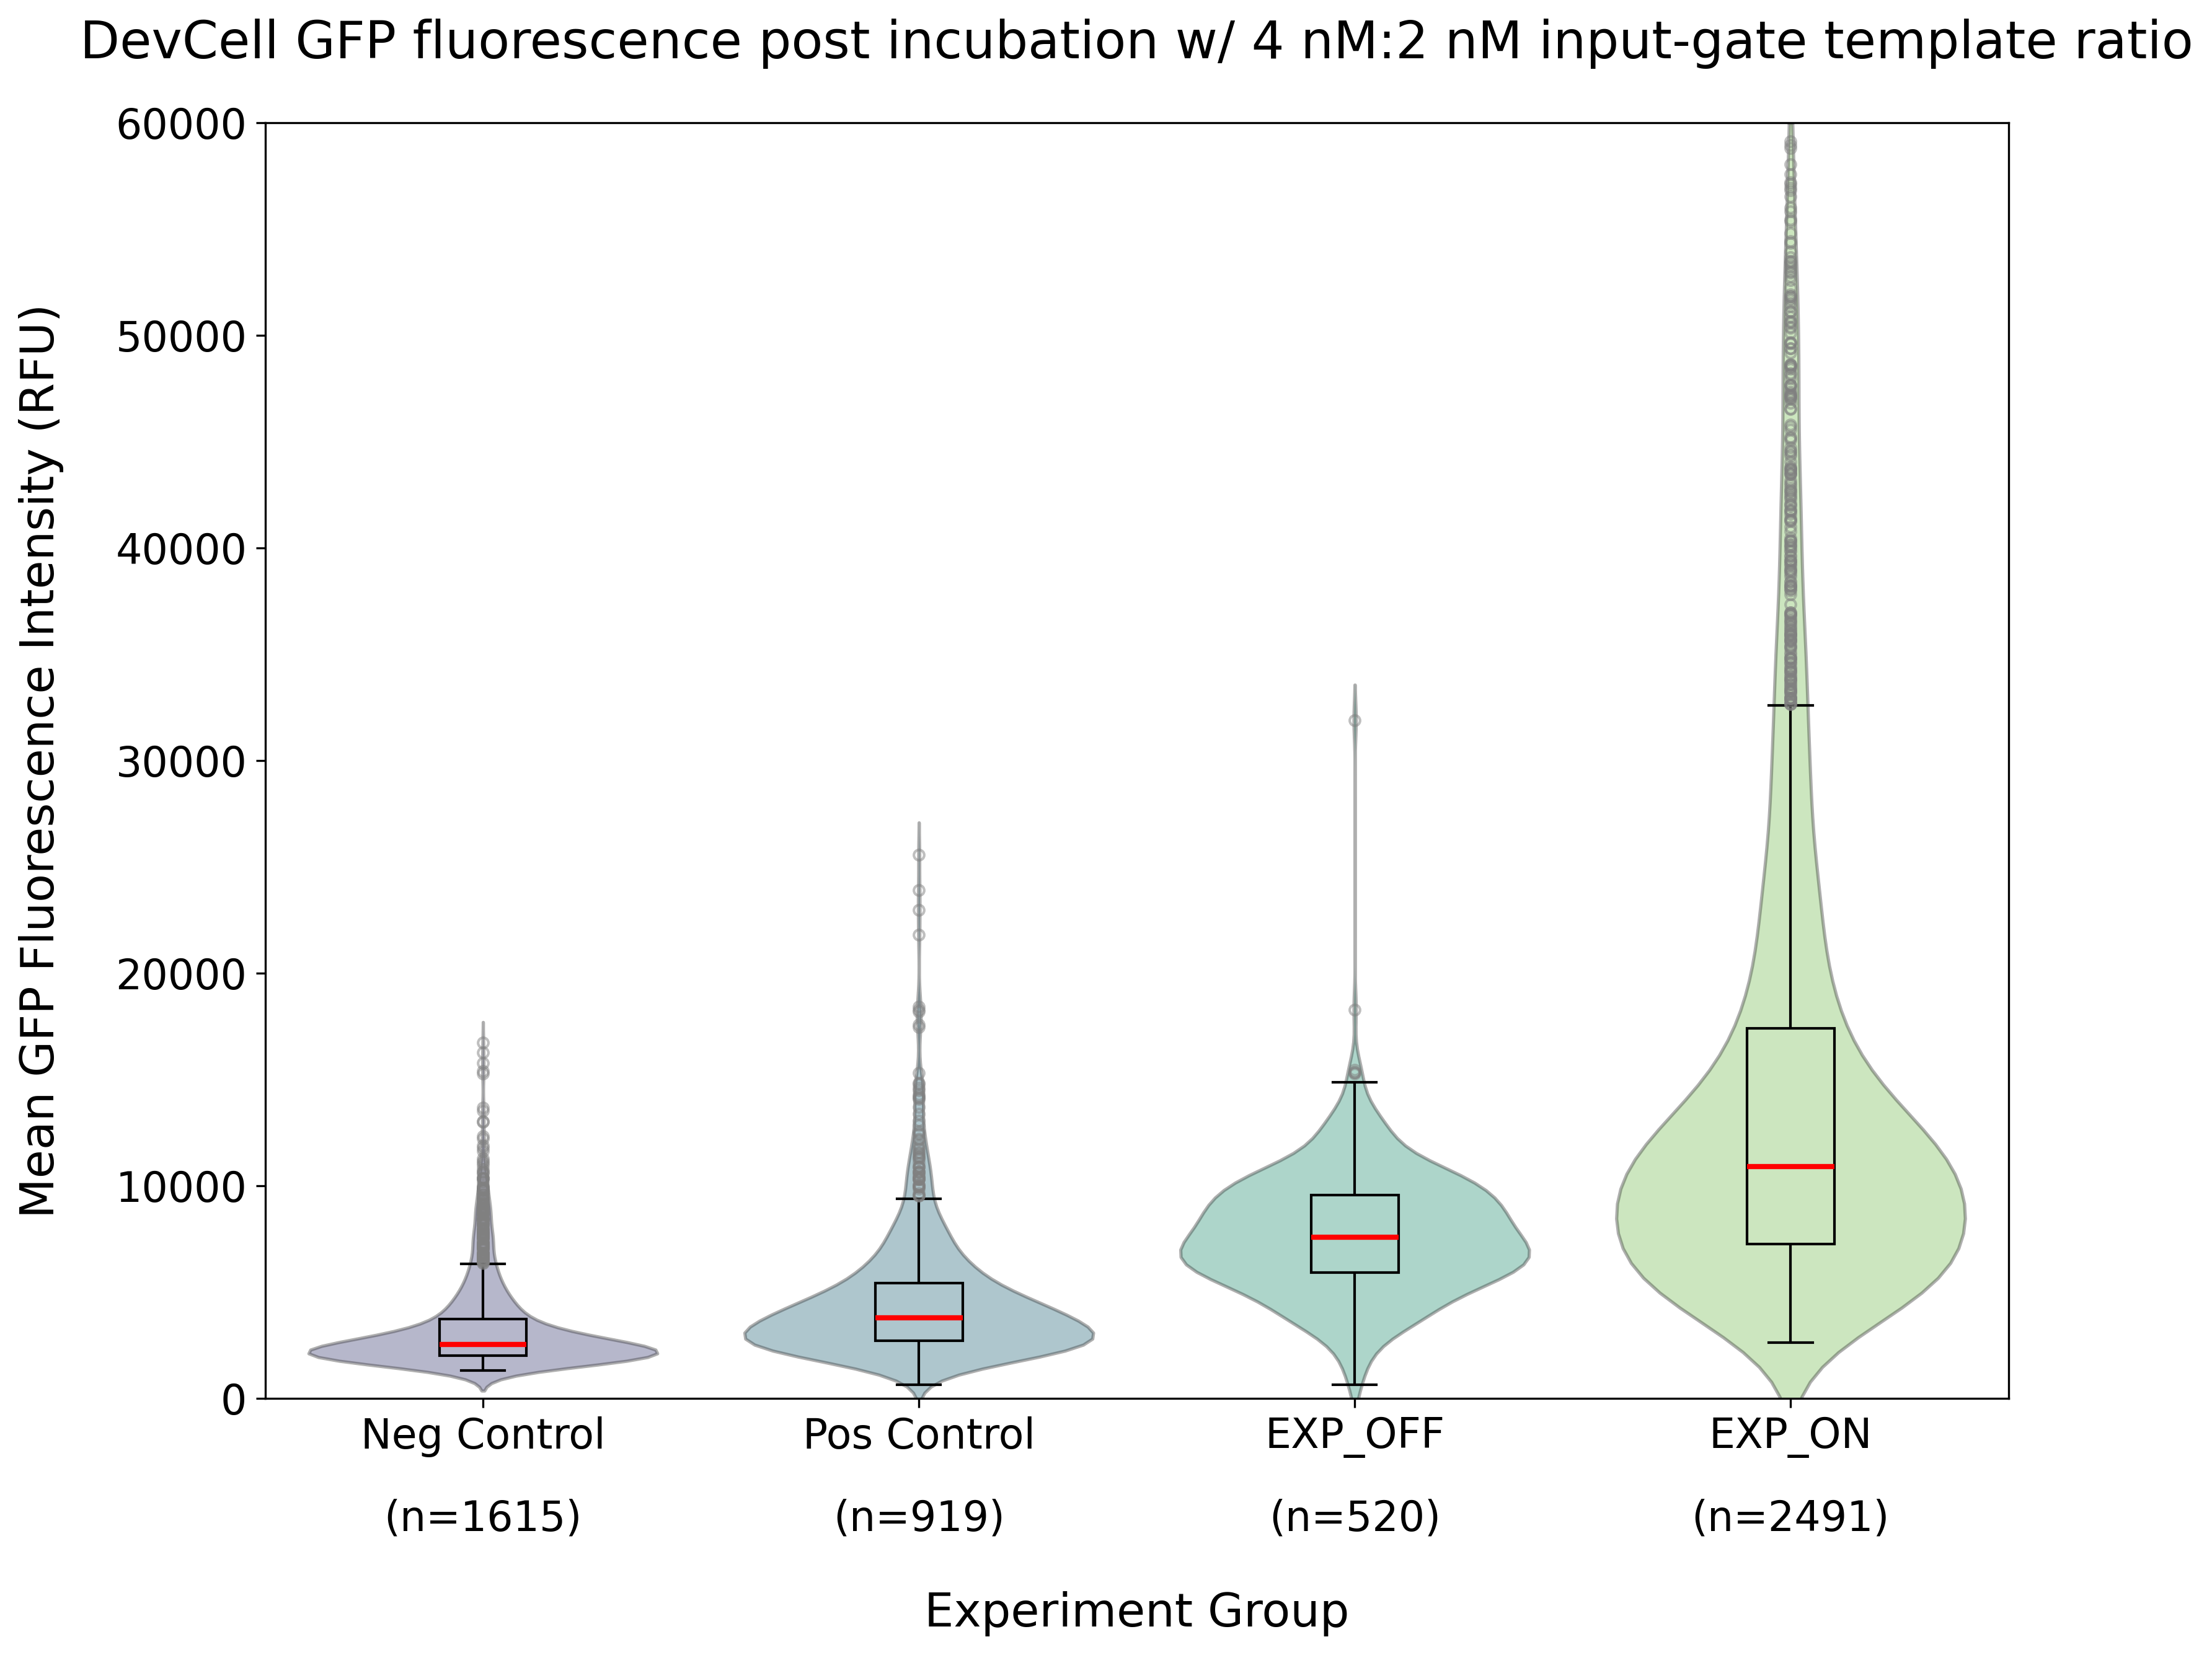
Figure 10:Quantified GFP fluorescence of DevCells after 1.5 h incubation at 37 °C using bulk cell-free input-gate template ratio (4 nM:2 nM). This analysis was conducted on the images collected in the same experiments as shown in Figure 9, with n indicating the number of DevCells quantified for each sample. See Figure 8 for schematics of the different samples.

Figure 11:Representative images of GFP fluorescence in DevCells after cell-free expression at 37 °C. Here, the input-gate template ratio was (20 nM:2 nM). Contrast and brightness adjustments were uniformly applied across all images for GFP (green) and Cy5 membrane dye (red) fluorescence channels. Scale bar: 100 µm.
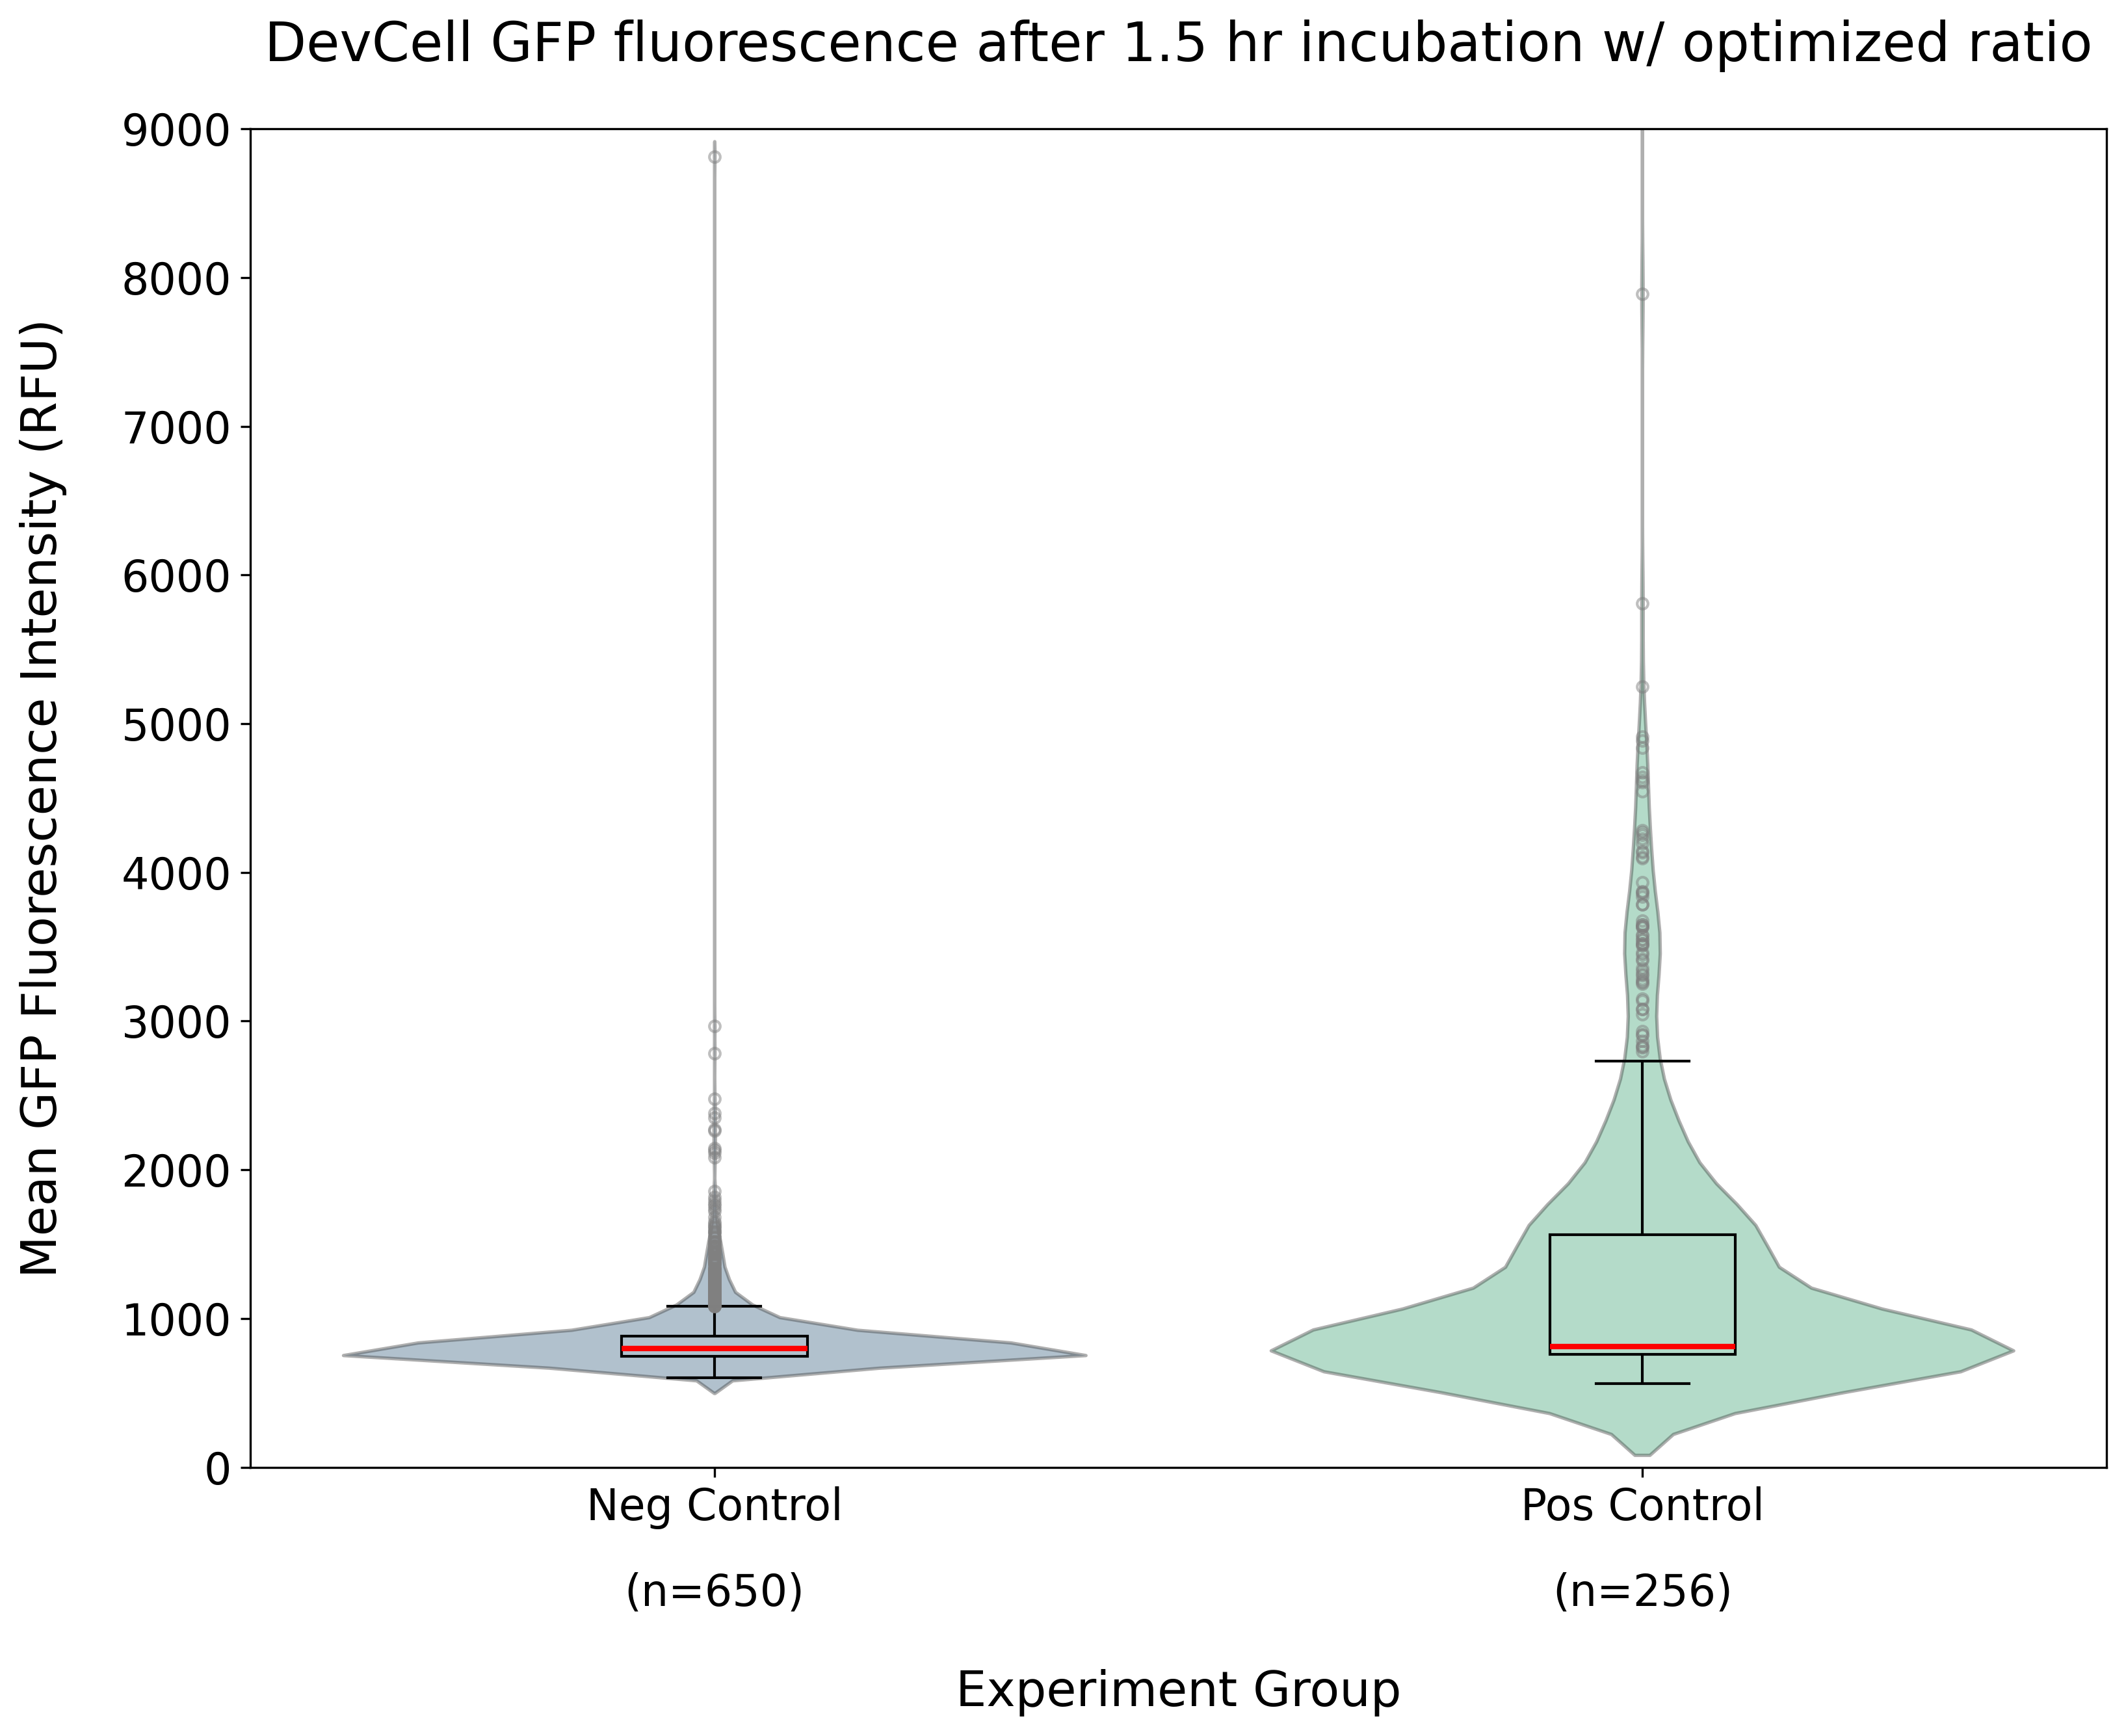
Figure 12:Quantified GFP fluorescence of DevCells after 1.5 h incubation at 37 °C using optimized input-gate template ratio (20 nM:2 nM). This analysis was conducted on the images collected in the same experiments as shown in Figure 11, with n indicating the number of DevCells quantified for each sample. See Figure 8 for schematics of the different samples.
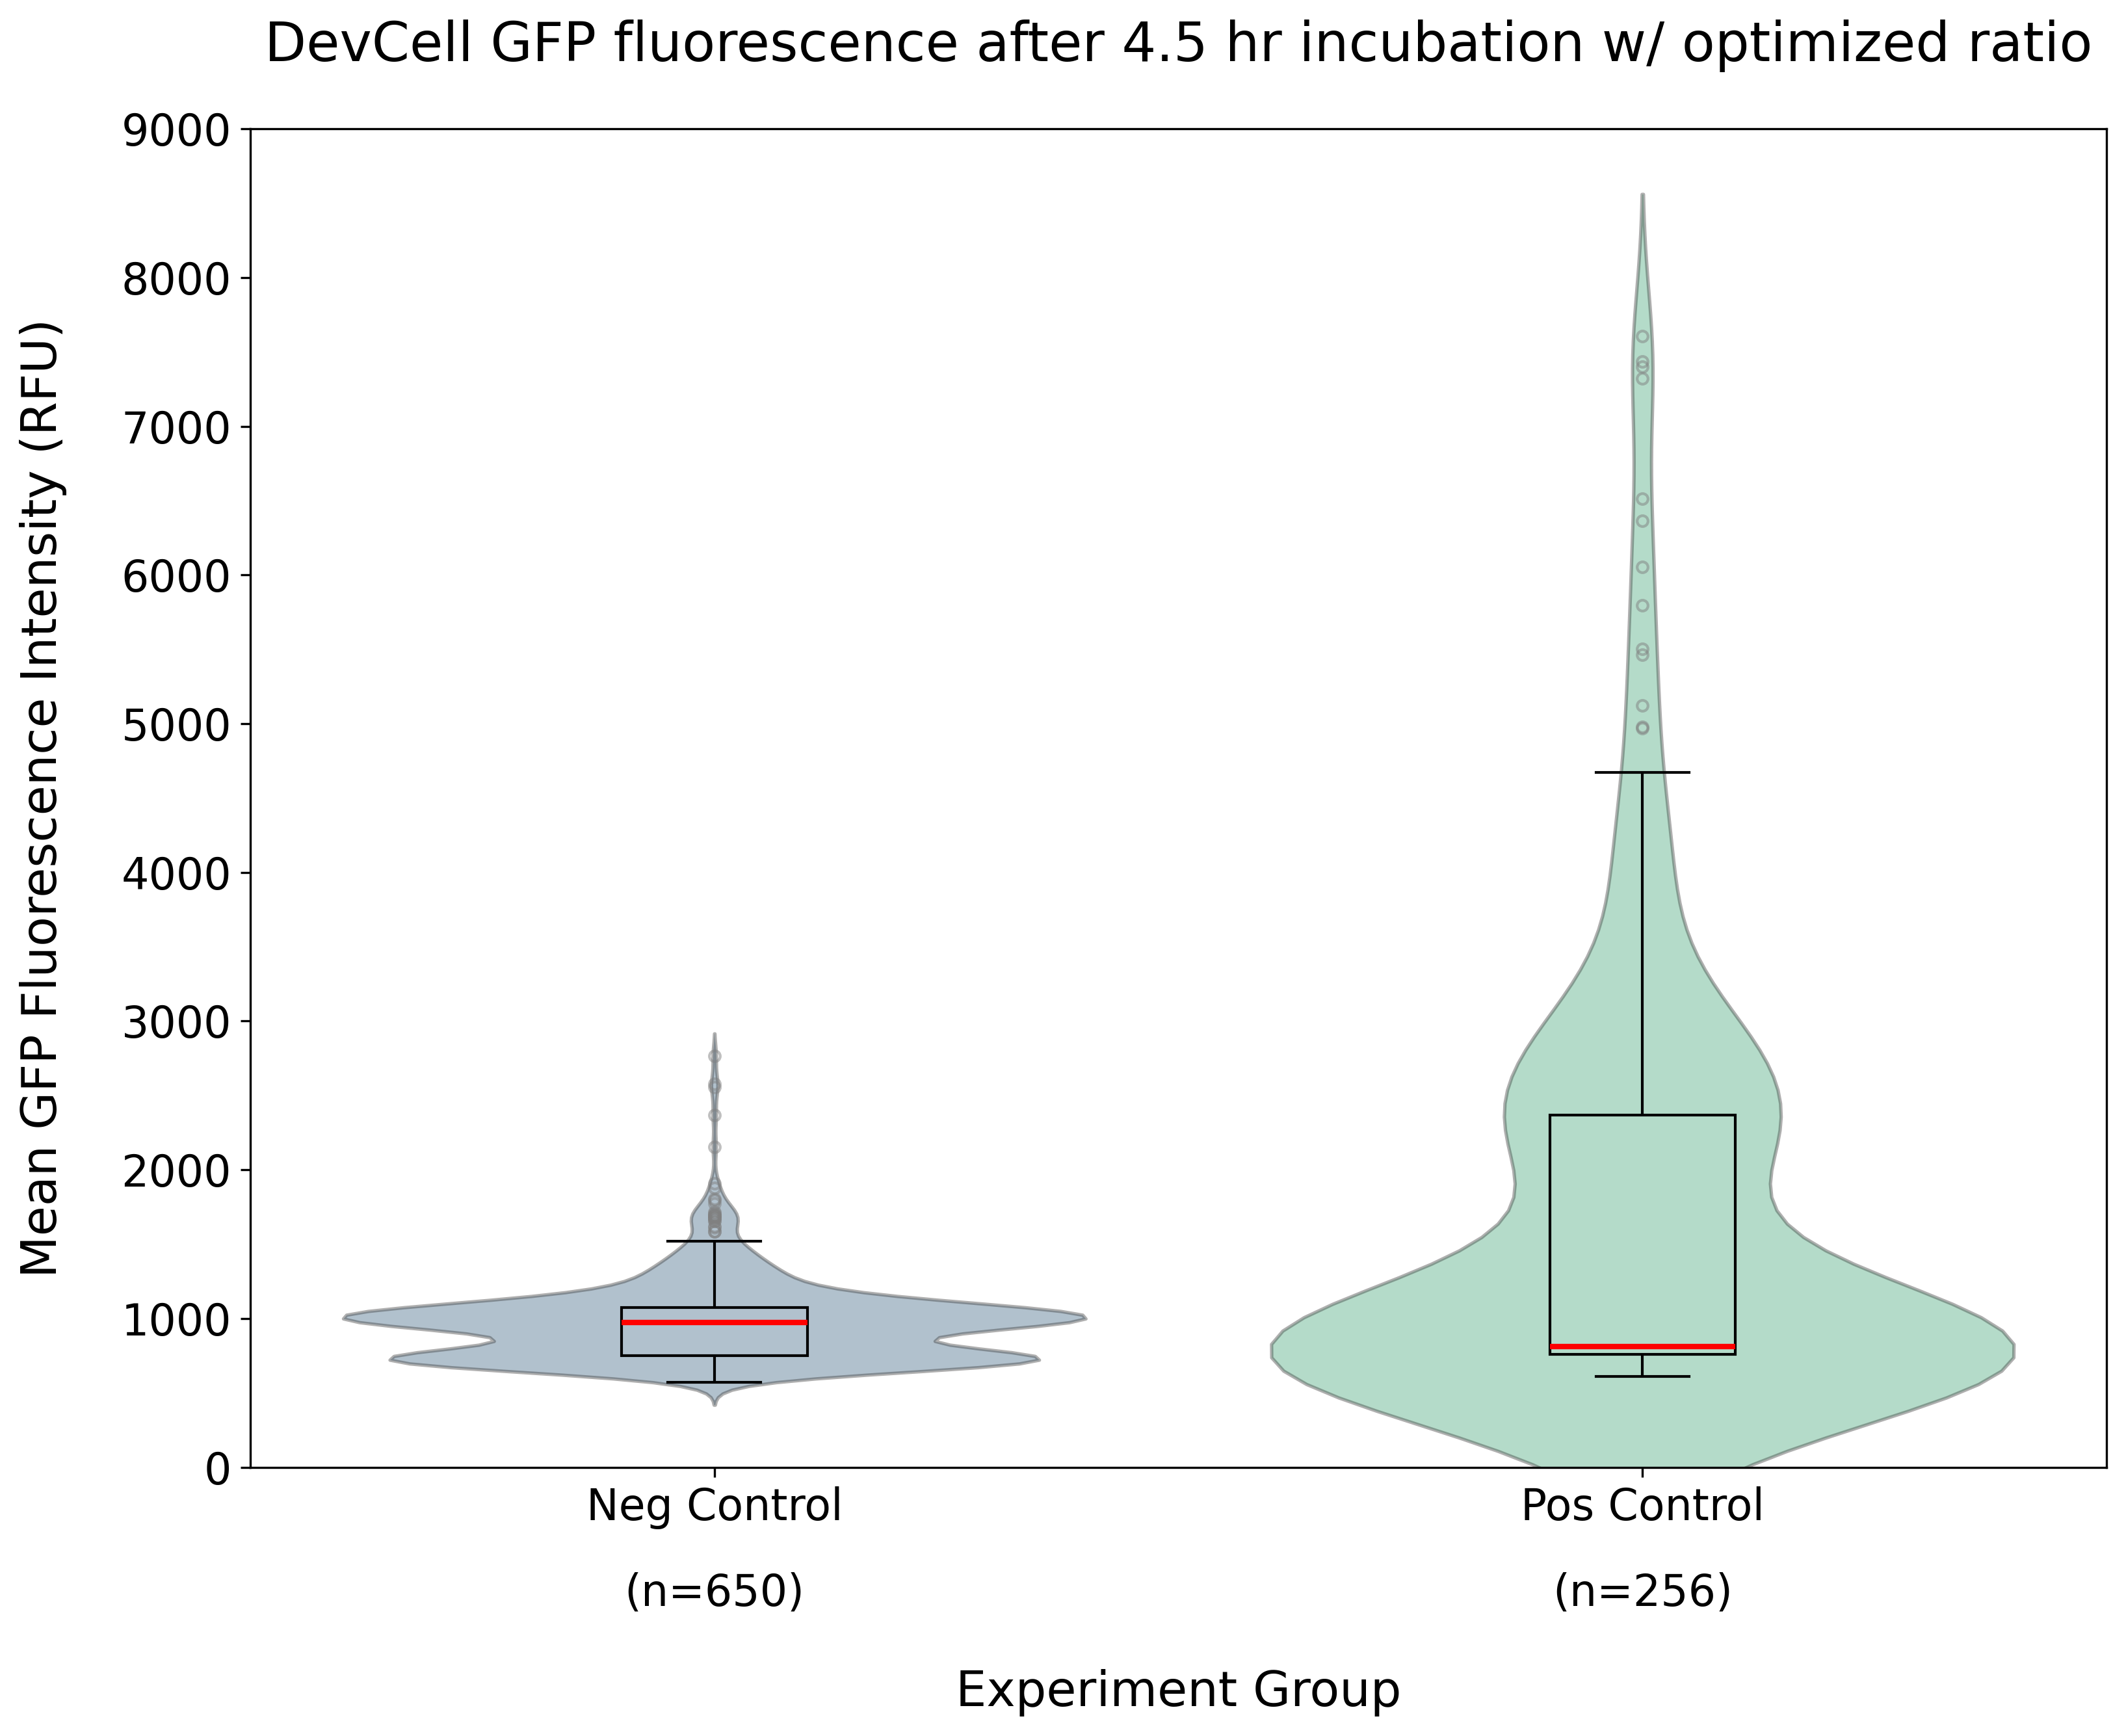
Figure 13:Quantified GFP fluorescence of DevCells after 4.5 h of incubation at 37 °C using optimized input-gate template ratio (20 nM:2 nM). This analysis was conducted on the images collected in the same experiments as shown in Figure 11, with n indicating the number of DevCells quantified for each sample. See Figure 8 for schematics of the different samples.
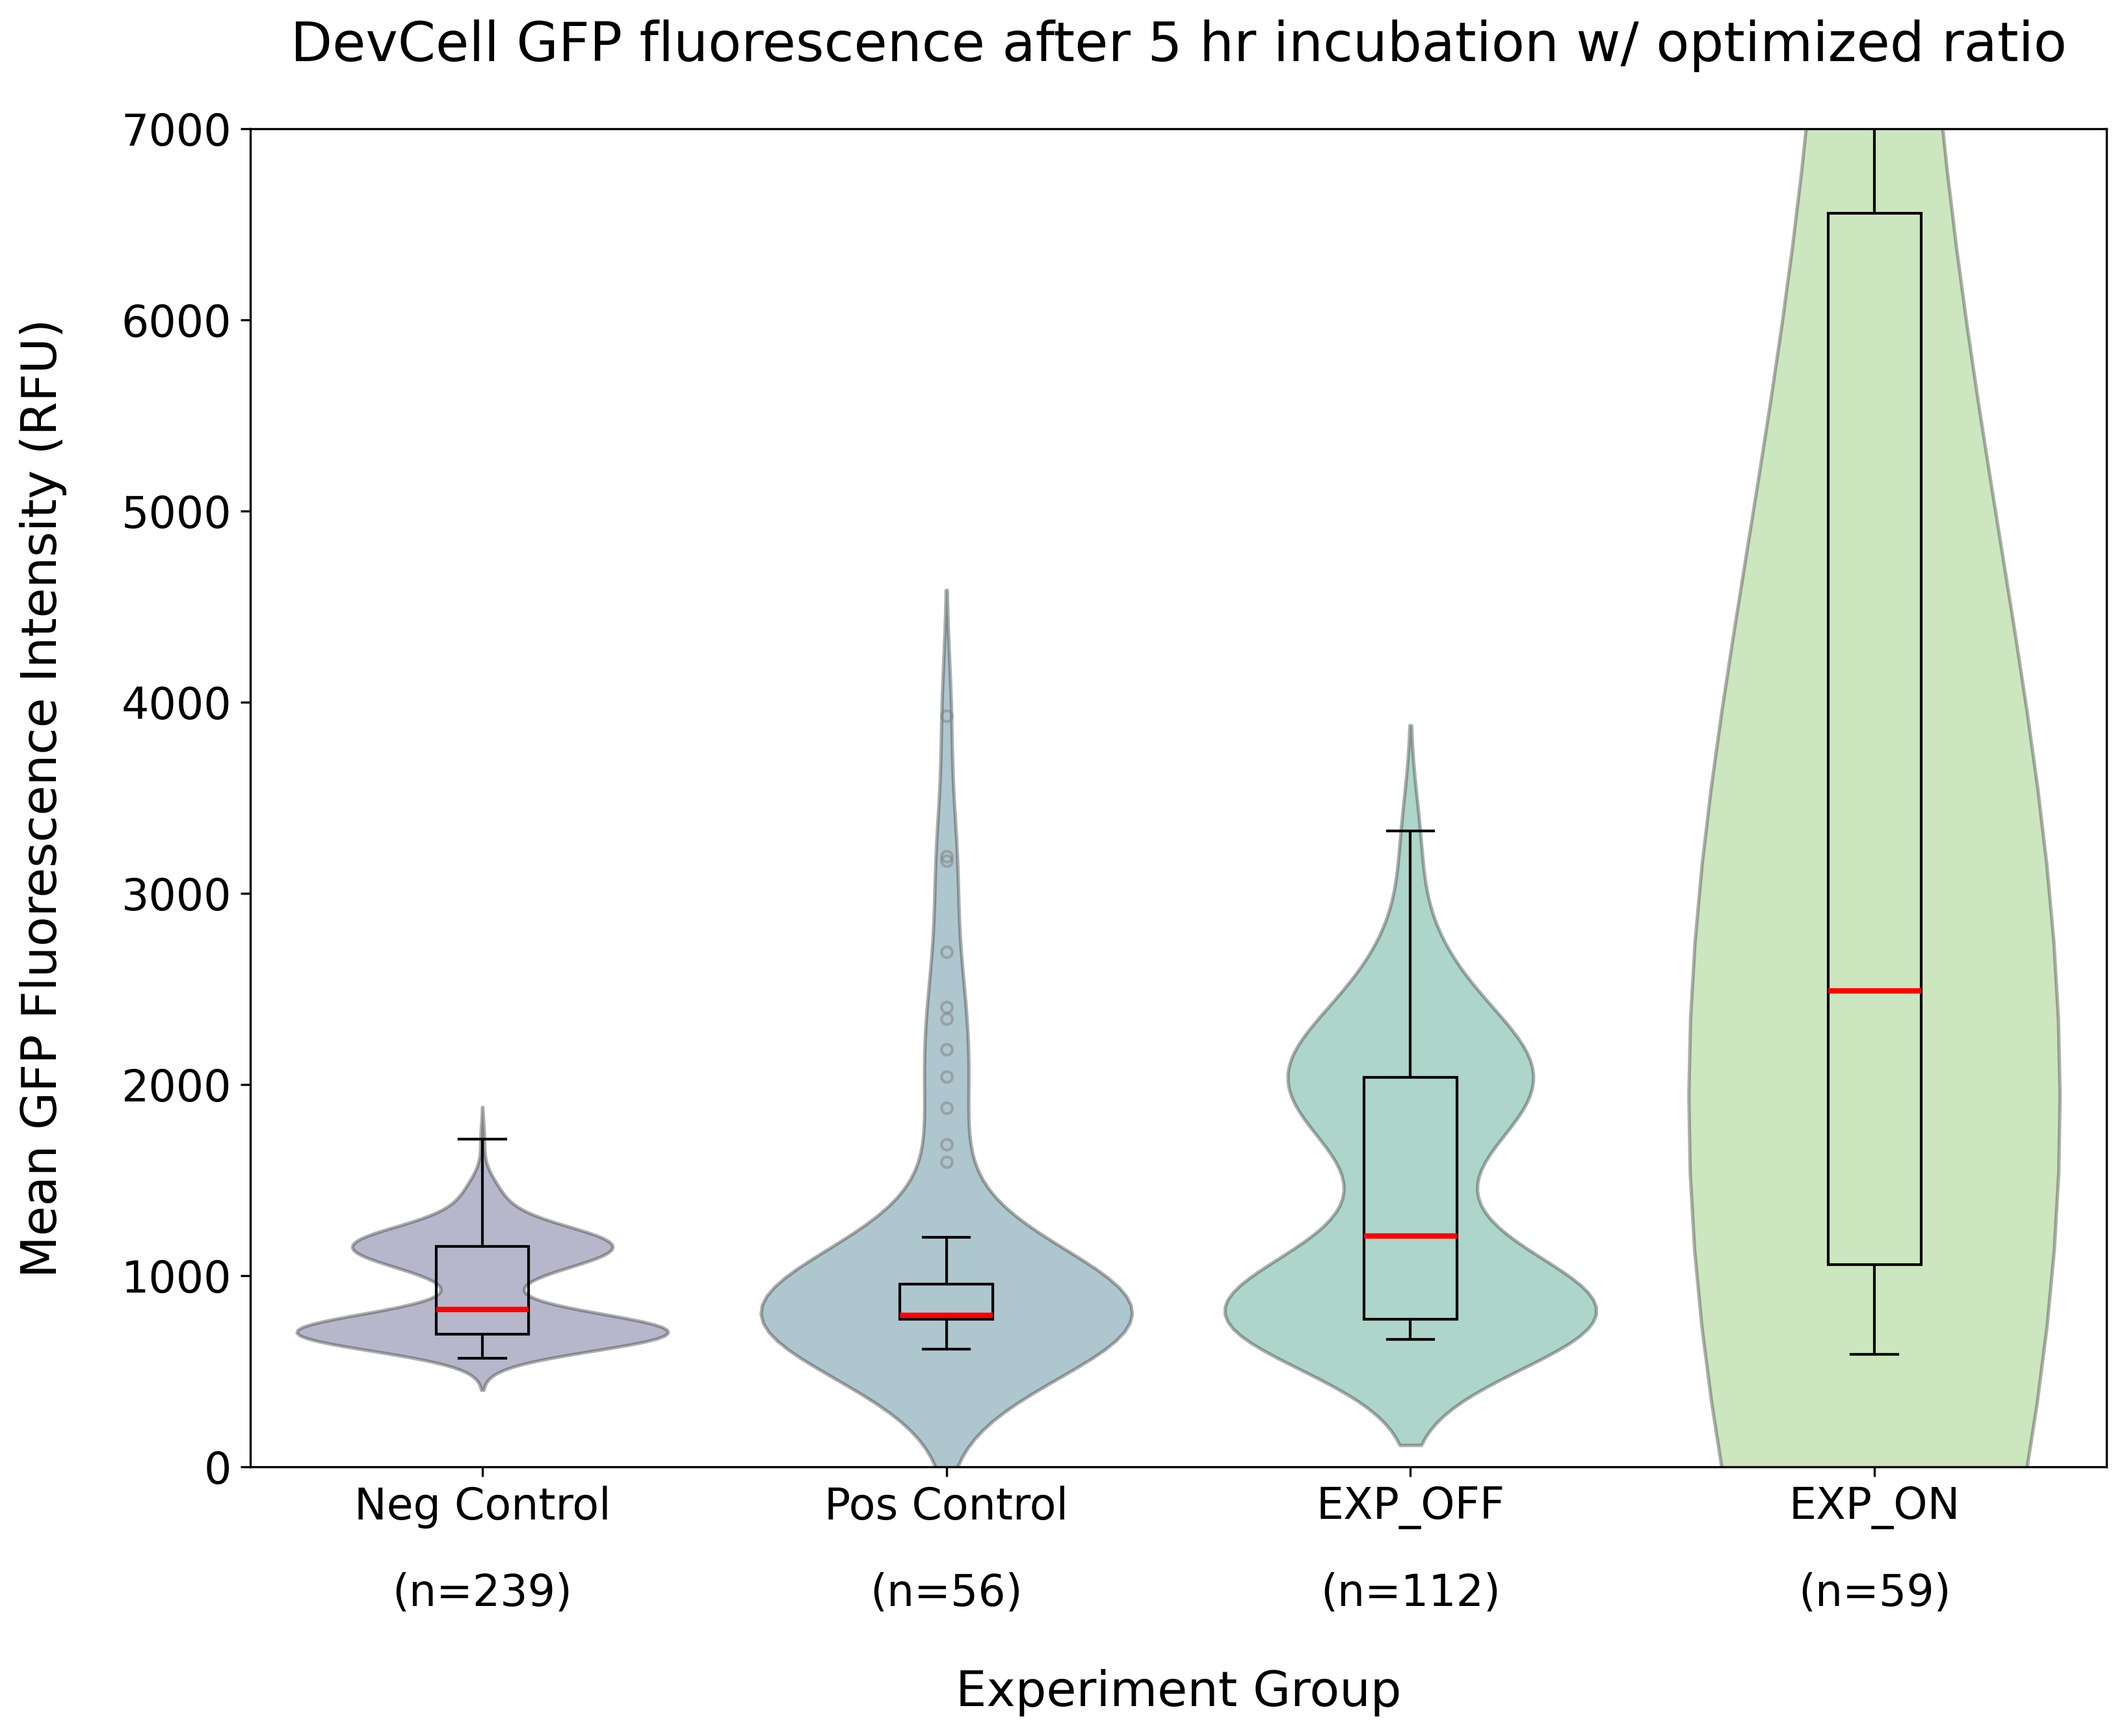
Figure 14:Quantified GFP fluorescence after 5 h incubation using optimized input-gate template ratio (20 nM :2 nM). Here, all four conditions (Neg Control, Pos Control, EXP OFF, EXP ON) are explored. n indicates the number of DevCells quantified for each sample. See Figure 8 for schematics of the different samples. The high fluorescence in EXP ON is due to aTc’s green fluorescence, making inference of any activation difficult.
Failure modes
A big failure mode was the green fluorescence of aTc. In future experiments, it is suggested to use a non-fluorescent read-out, such as luminescence, to mitigate this issue. At high concentrations, the aTc signal was so strong that it bled through channels other than the GFP channel, so switching to another fluorescent protein may not resolve the issue. We also found that aTc photobleached very quickly with our microscope setup, which can inactivate the molecule for binding (Baumschlager et al. 2020).
Not getting a high enough concentration of each of the templates in the DevCells is another potential source of failure. There is still more work that needs to be done around optimizing the concentrations of multi-template systems in DevCells.
Resources
THE riboregulator DevNote: devnotes
.nucleus .engineering /articles /ss -20260712 TetR/aTc detector module (Nucleus documentation): docs
.nucleus .engineering /docs /modules /detector -tetr -atc /spec ROSALIND small-molecule biosensor DevNote (Khalid Alam): devnotes
.nucleus .engineering /articles /ka -30072024 THE riboregulators in cell-free: biorxiv
.org /content /10 .1101 /2025 .09 .25 .678518v2 ctRSD and THE riboregulator sequence compiler
Annotated sequence / plasmid maps from published THE riboregulator manuscripts
Participants
CSHL Week 2 participants: Gabriela Garza, Luis Montalvo-Gonzalez, Rocky Choi, Corynne Adanho, Sushmita Halder, Dwon Jordana, Grace Montgomery.
- aTc
- anhydrotetracycline
- CFP
- cyan fluorescent protein
- GFP
- green fluorescent protein
- THE
- toehold exchange
- TX
- transcription