Microscopy Analysis
try:
    import cdk
    print("CDK already installed, skipping installation and restart.")
except ImportError:
    !pip install nucleus-cdk -q > /dev/null 2>&1
    print("\nInstallation complete. Restarting runtime to refresh dependencies...")
    import os
    os._exit(0)
CDK already installed, skipping installation and restart.
import numpy as np
import pandas as pd
import matplotlib.pyplot as plt
import seaborn as sns

from cdk.analysis import cell as m
WARNING:cellpose.vit:Could not import CPDINO, run `pip install git+https://github.com/facebookresearch/dinov3` to use CPDINO model
Load data
%%writefile drive_utils.py
import os
import re

import gdown


def get_drive_file_id(url):
    """Extract the file ID from a Google Drive share URL."""
    match = re.search(r'/d/([a-zA-Z0-9_-]+)', url)
    if match:
        return match.group(1)
    return None


def download_from_drive(files_info, destination_dir):
    """
    Download files from Google Drive.

    Args:
        files_info (list): List of dicts with 'url' and 'filename'.
        destination_dir (str): Local path to save files.
    Returns:
        dict: Mapping of filenames to local paths.
    """
    os.makedirs(destination_dir, exist_ok=True)

    paths = {}
    for item in files_info:
        url = item['url']
        filename = item['filename']
        dest = os.path.join(destination_dir, filename)
        file_id = get_drive_file_id(url)

        if file_id:
            gdown.download(id=file_id, output=dest, quiet=True)
        else:
            gdown.download(url, output=dest, quiet=True)

        paths[filename] = dest
    return paths
Overwriting drive_utils.py
# Set use_drive = True to download platemap.csv from Google Drive instead of using a local file.
# The Drive file must have its permissions set to "Anyone with a link" can "view".
use_drive = True

if use_drive:
    from drive_utils import download_from_drive

    files_to_download = [
        {
            "url": "https://drive.google.com/file/d/17T9CJkq3yOF23OkPDqcOclaWpDAu1YkS/view?usp=sharing",  # Replace with your platemap file link.
            "filename": "platemap.csv",
        },
    ]
    downloaded_paths = download_from_drive(files_to_download, destination_dir="data")
    PLATEMAP_PATH = downloaded_paths["platemap.csv"]
else:
    PLATEMAP_PATH = "platemap.csv"

print(f"Platemap file: {PLATEMAP_PATH}")
Platemap file: data/platemap.csv
ZARR_URL = "https://data.nucleus.engineering/microscopy/valine/820-720-620-520-420_2026-08-26_12-32-14.888144.zarr"
PARQUET_URL = "https://data.nucleus.engineering/microscopy/valine/820-720-620-520-420_2026-08-26_12-32-14.888144.parquet"

data = m.load(PARQUET_URL, PLATEMAP_PATH) #, sample=5000)
Check Cell Segmentation
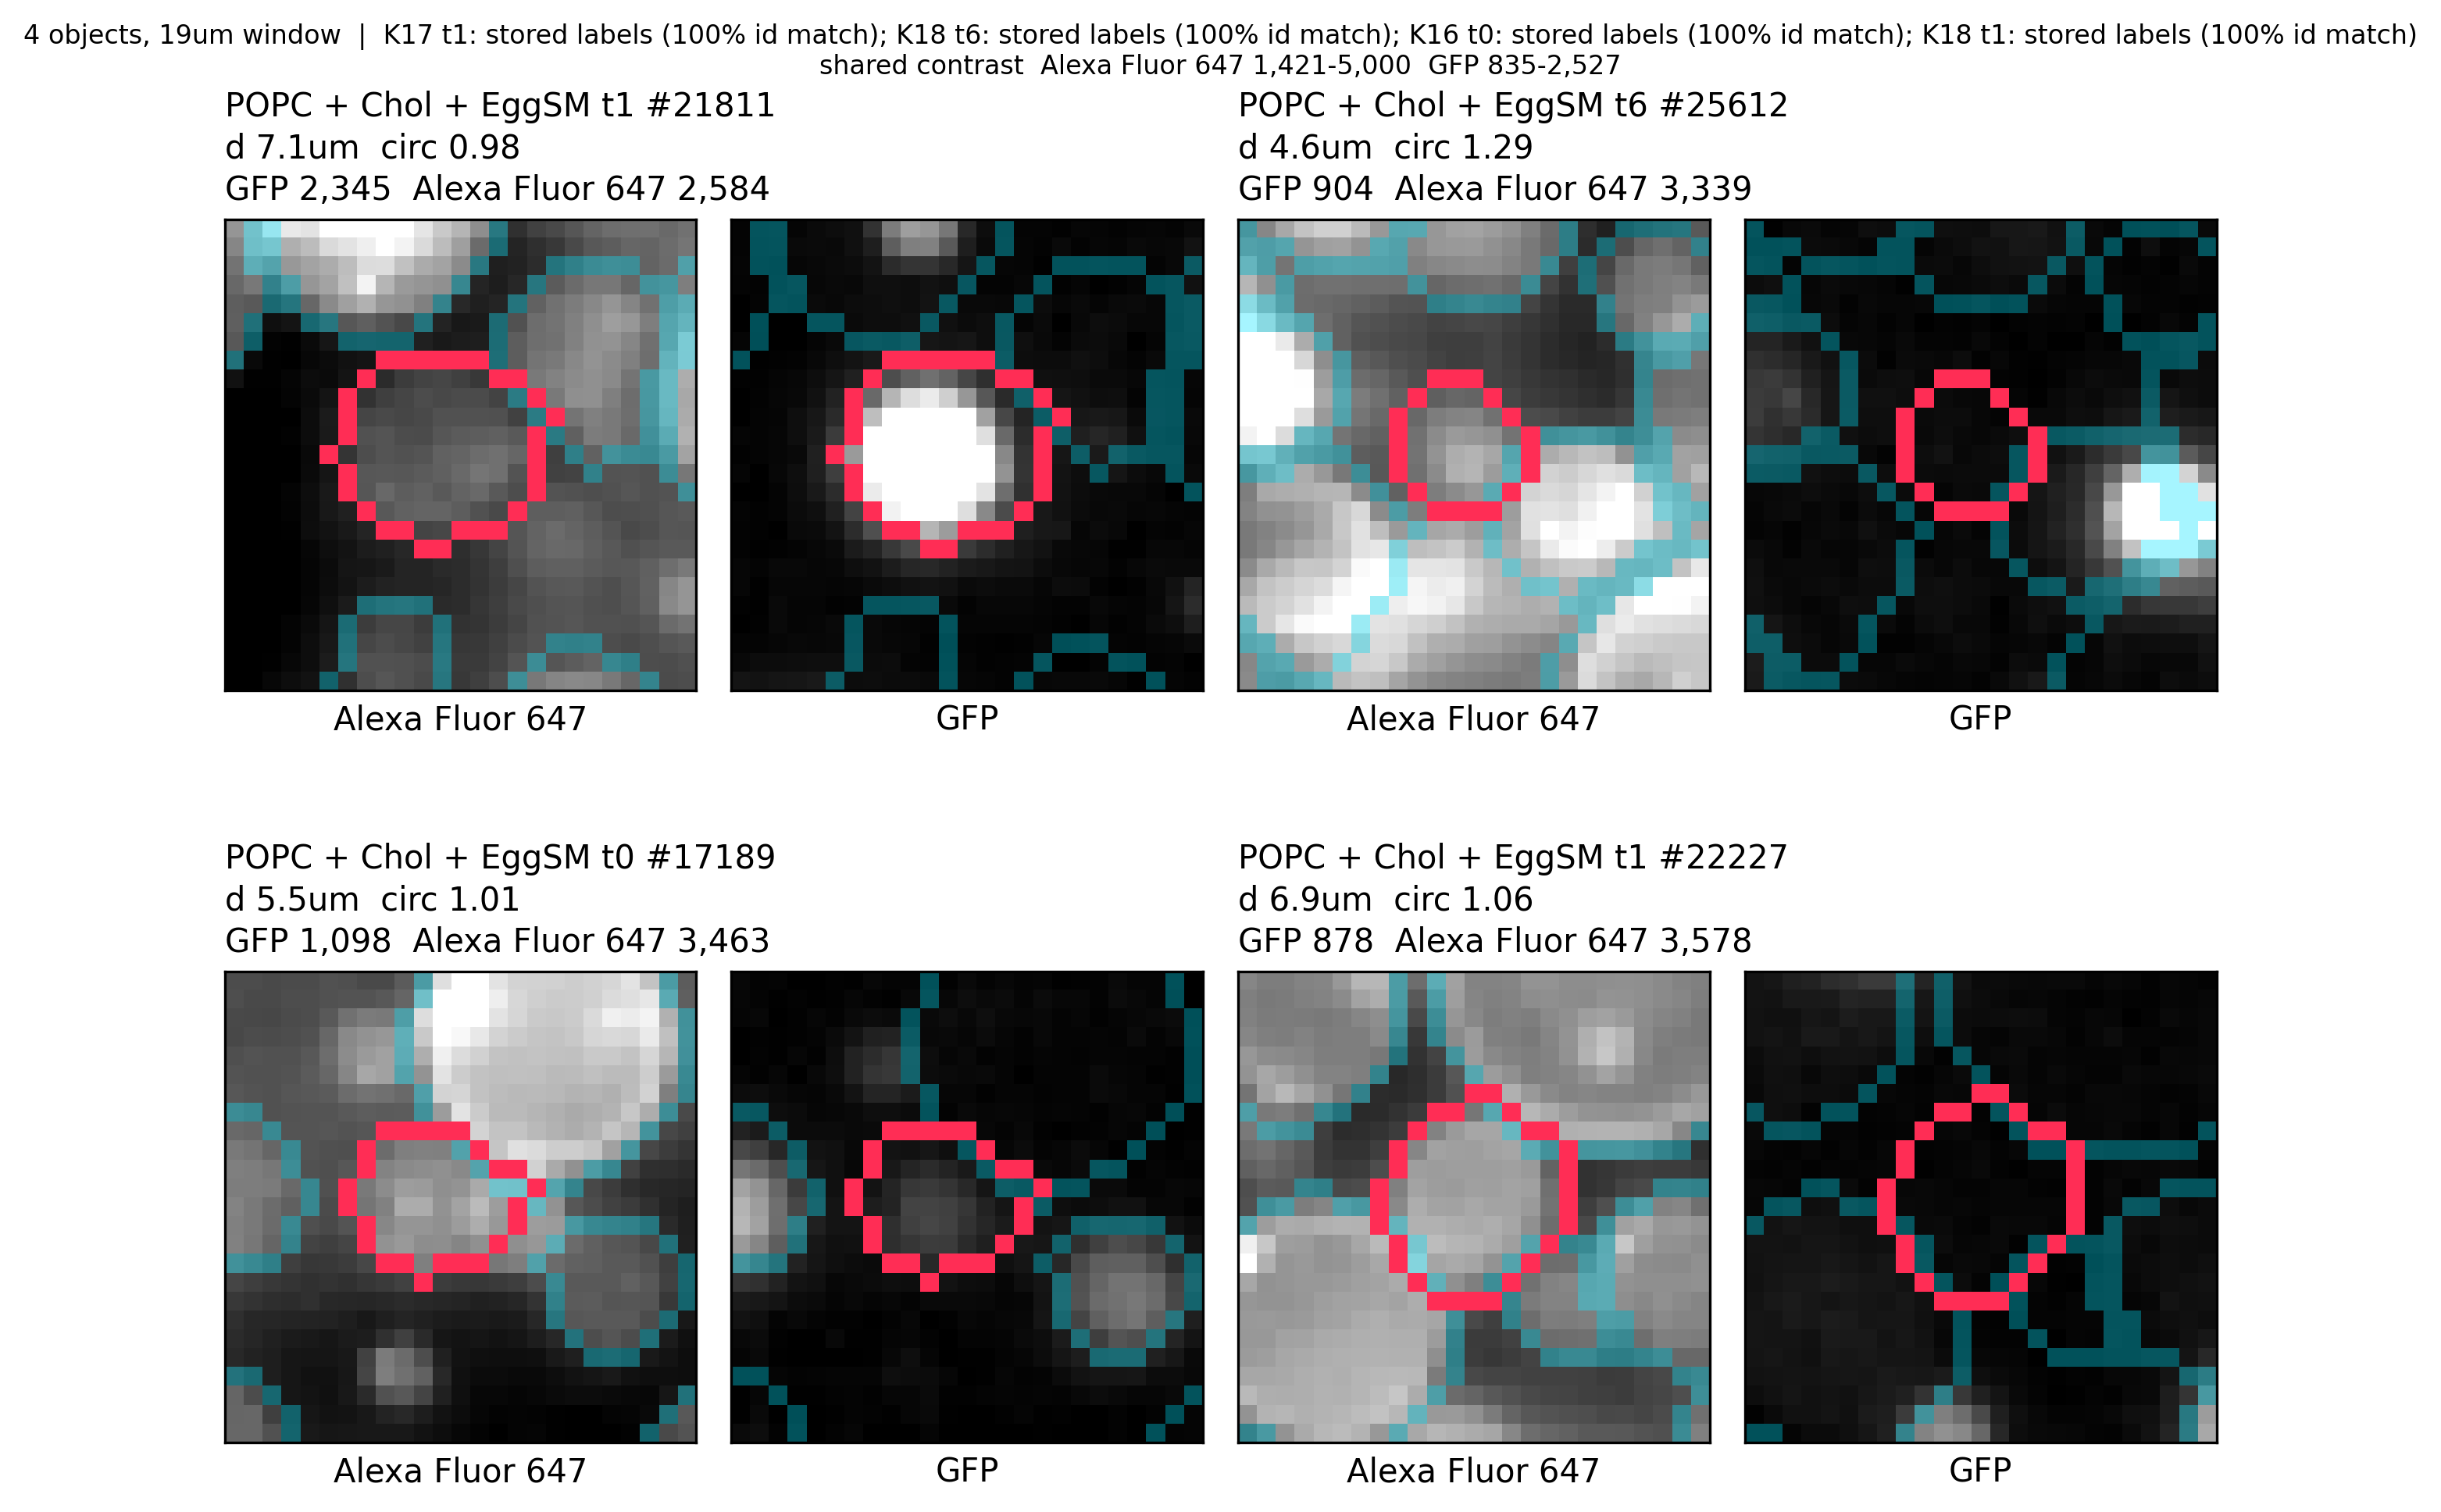
Optionally check cells - - will take a few seconds since this reads from a zarr file! If you want faster, load the zarr specifically into this folder. Dont use a URL.
NUM_CELLS_TO_CHECK = 4
m.plot_cell_grid(data, ZARR_URL, n=NUM_CELLS_TO_CHECK, pyramid_level=2)
# example_indexed_data = data[(data.Well == data.Well.unique()[0]) & (data.Timepoint == 0)]
# m.plot_cell_grid(example_indexed_data, ZARR_URL, n=5, channels=["Alexa Fluor 647"], pyramid_level=2) #show just one channel channels
# m.plot_cell_grid(one, ZARR_URL, n=NUM_CELLS_TO_CHECK, contrast="tile", pyramid_level=2) #make the intensity contrast scaled by tile not by the whole grid
WARNING:cdk.analysis.cell.segmentation_qc:Centroid columns ['Centroid', 'Centroid.1'] predate the axis-named ['Centroid Y (um)', 'Centroid X (um)']; assuming column order is (y, x).
Loading...
Summary Plots
_ = m.plot_qc(data, hue="Name") #facet="other_col"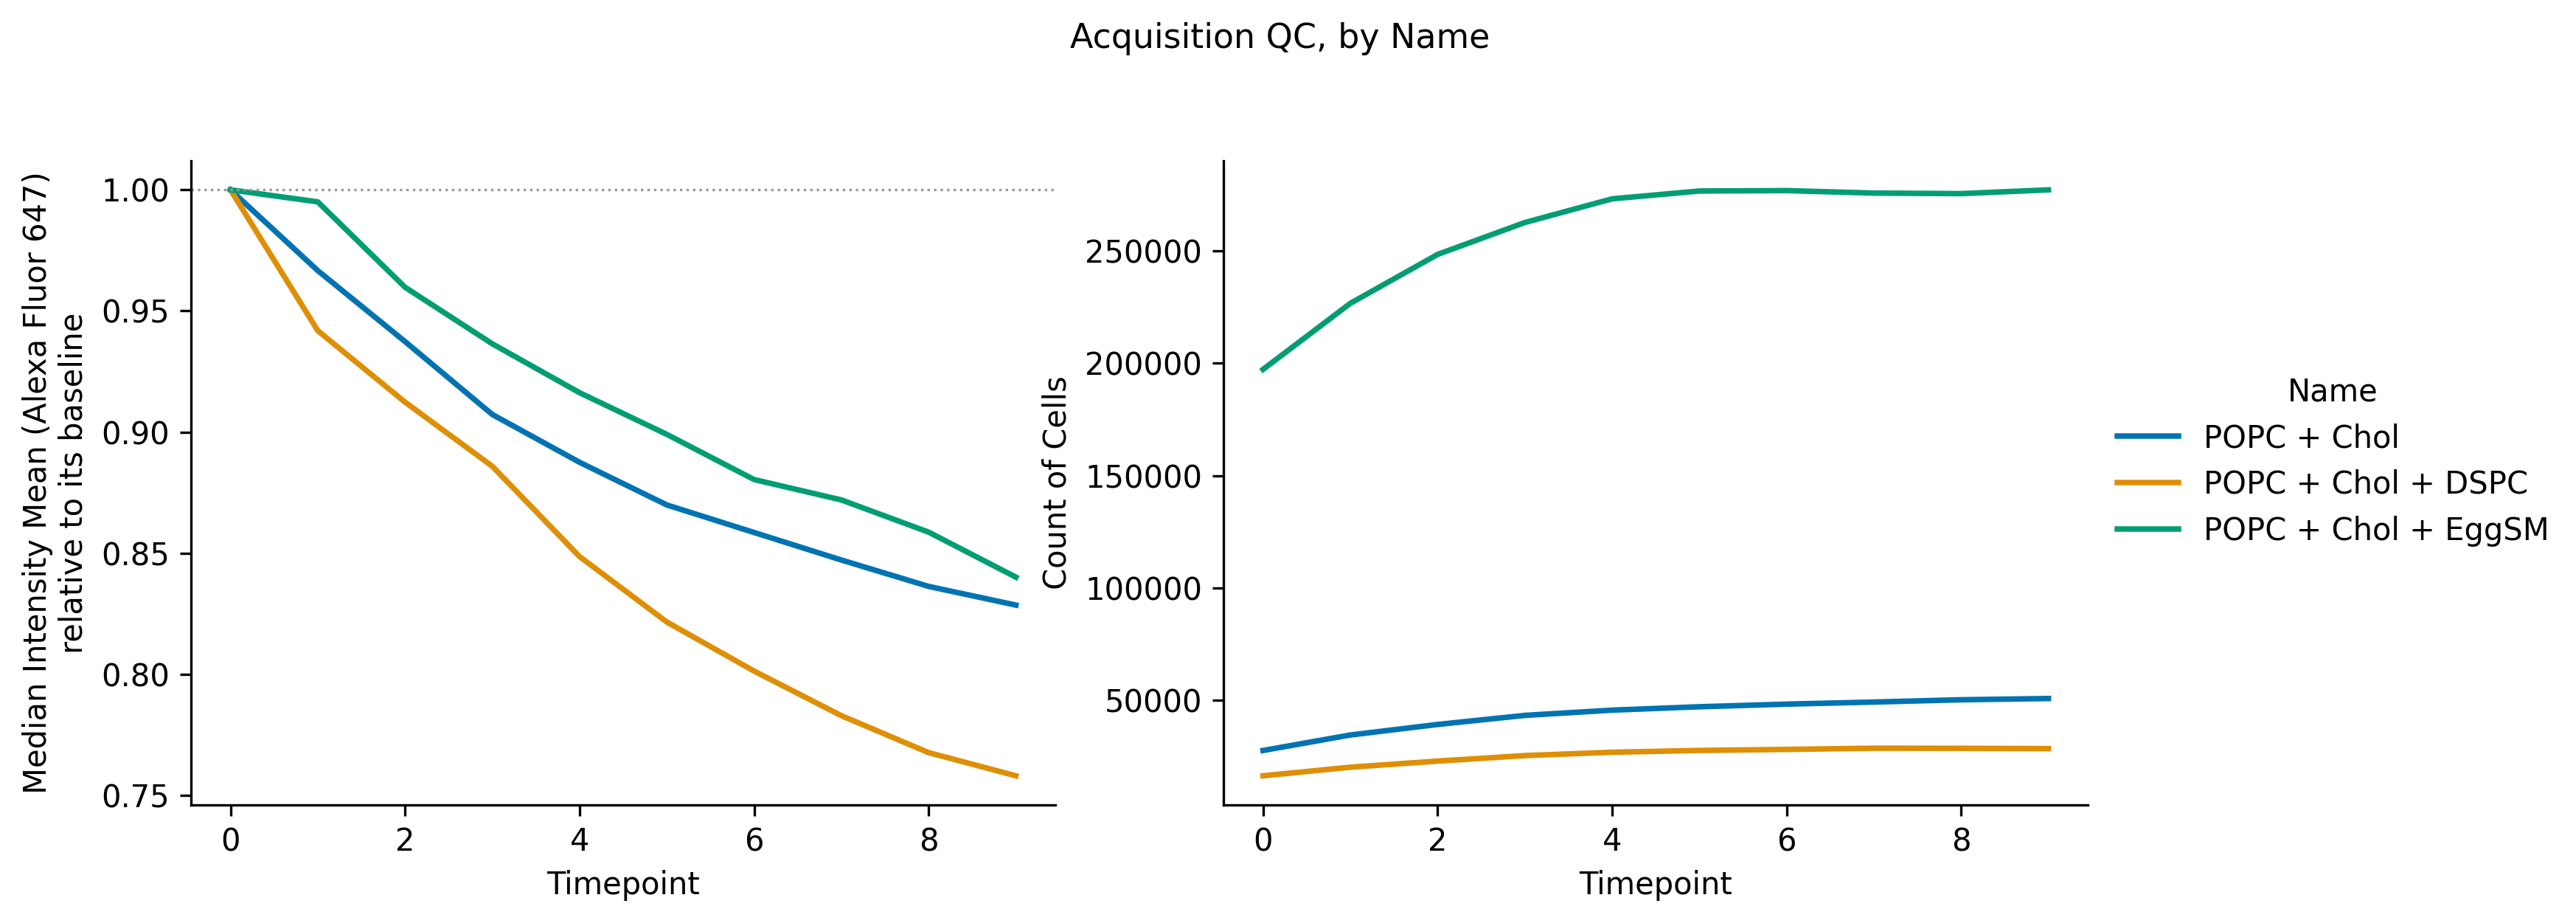
_ = m.plot_quantile_ribbon(data, hue="Name") #facet="other_col"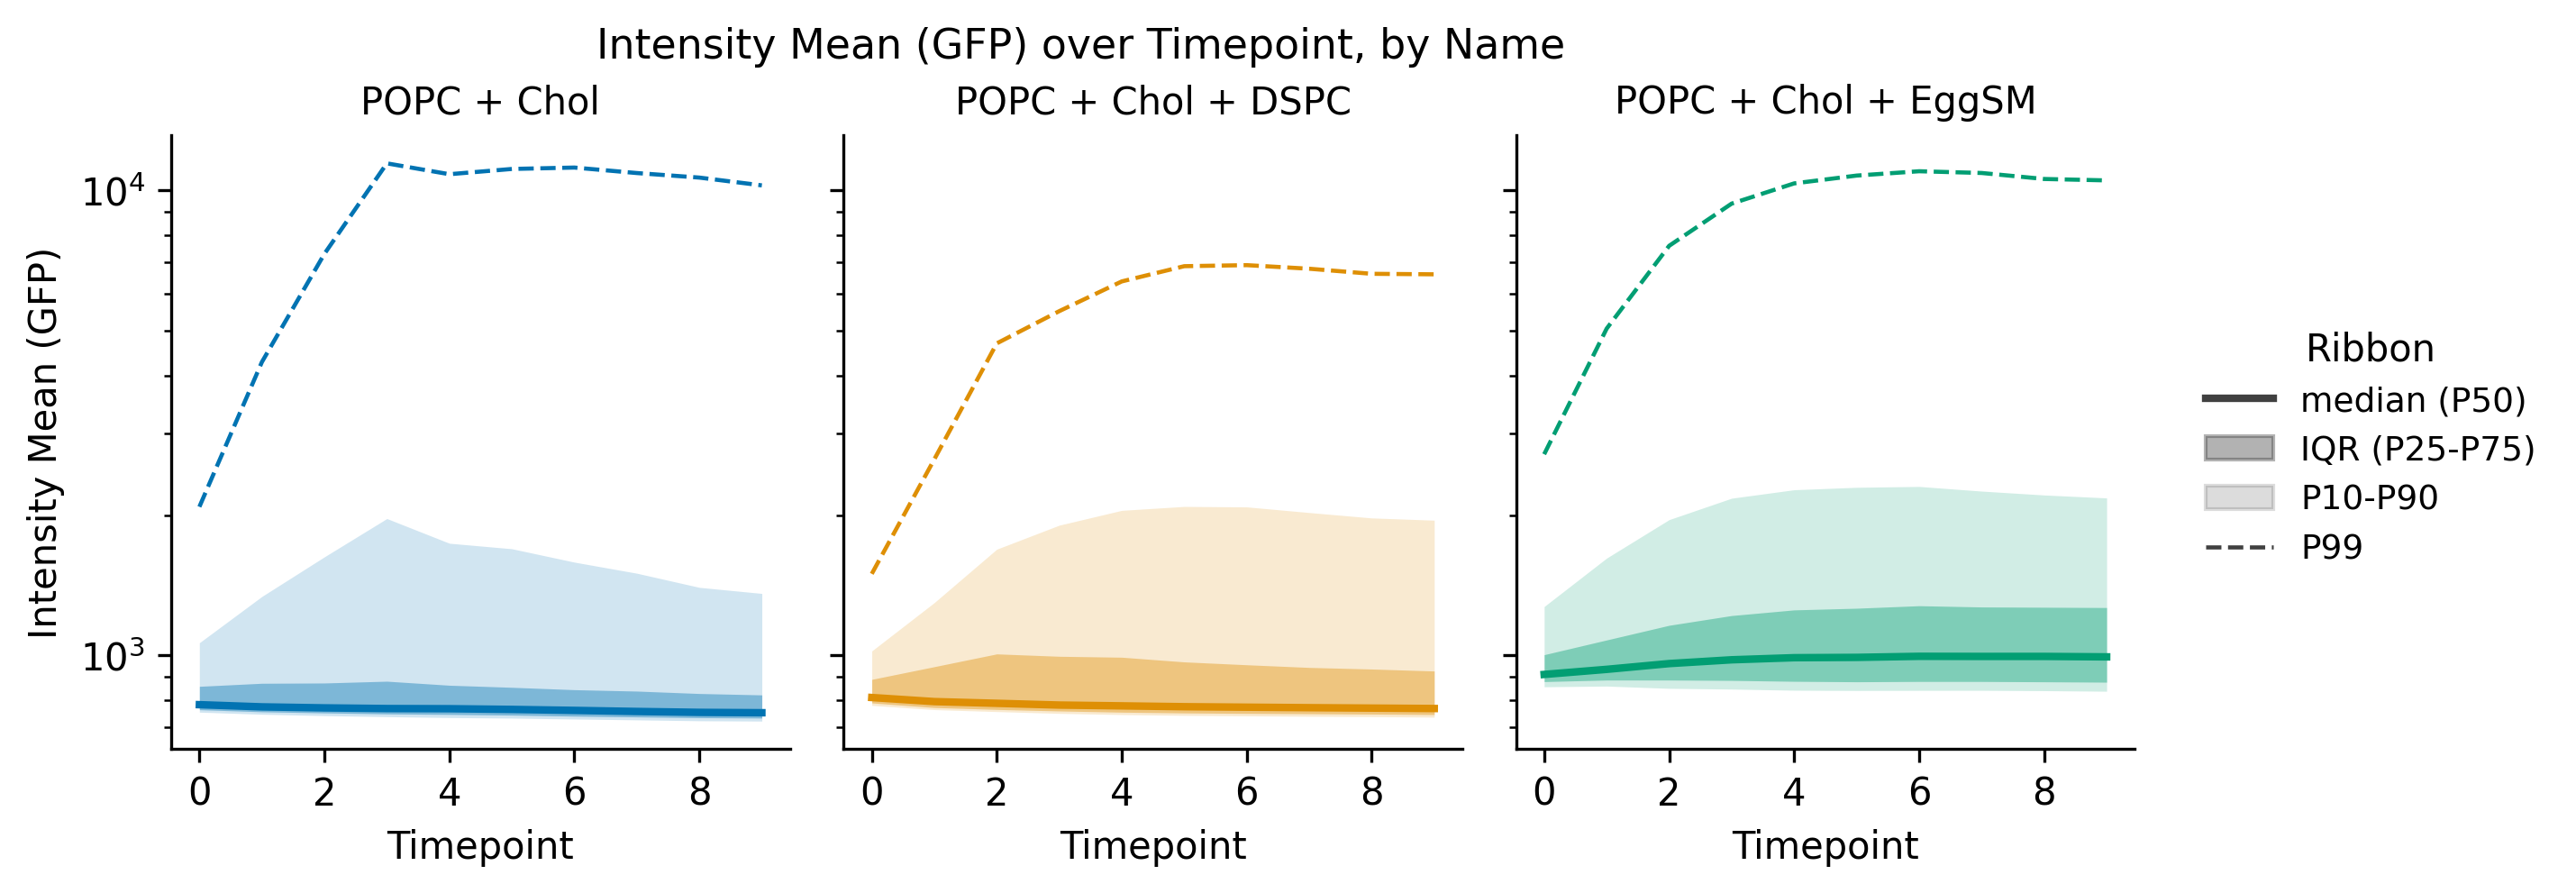
# how many cells turn on, and how bright did they get.Default shows the 99th percentaile
_ = m.plot_positive_fraction(data, gate_quantile=0.99, hue="Name") #,facet="other_col"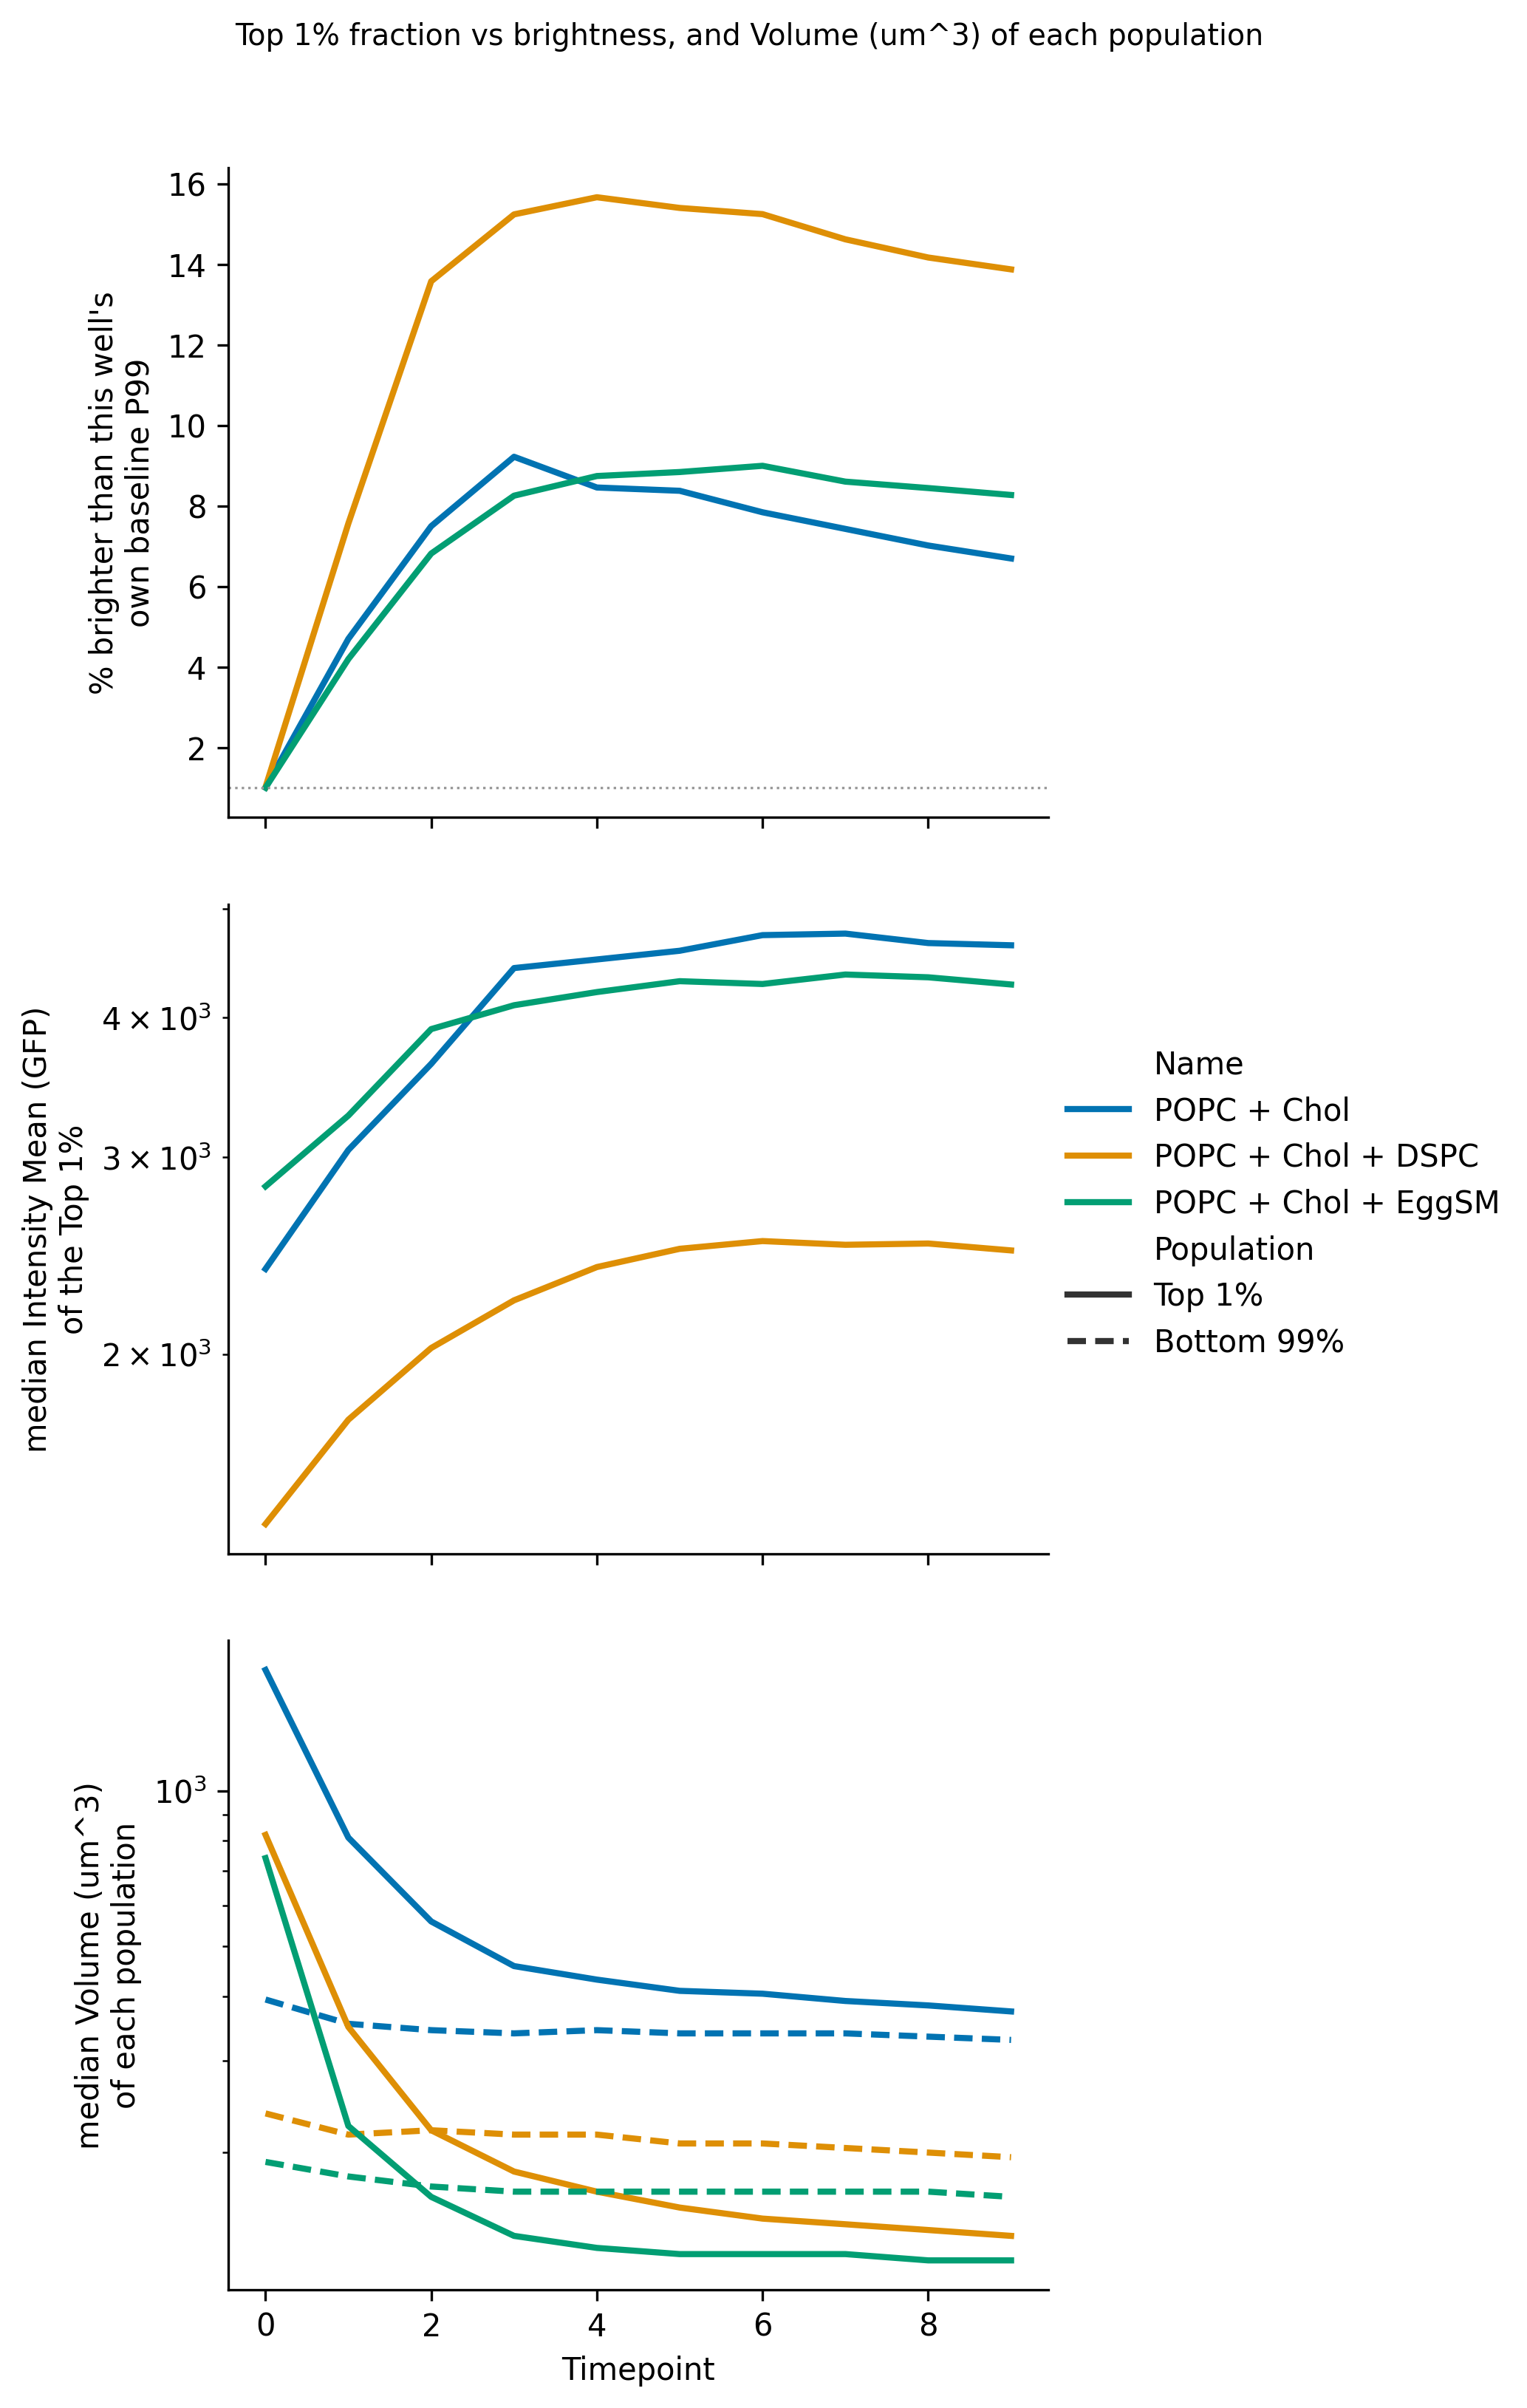
_ = m.plot_size_expression(data, facet="Name") #, timepoints=[1,3,5,7,9], facet="other_col")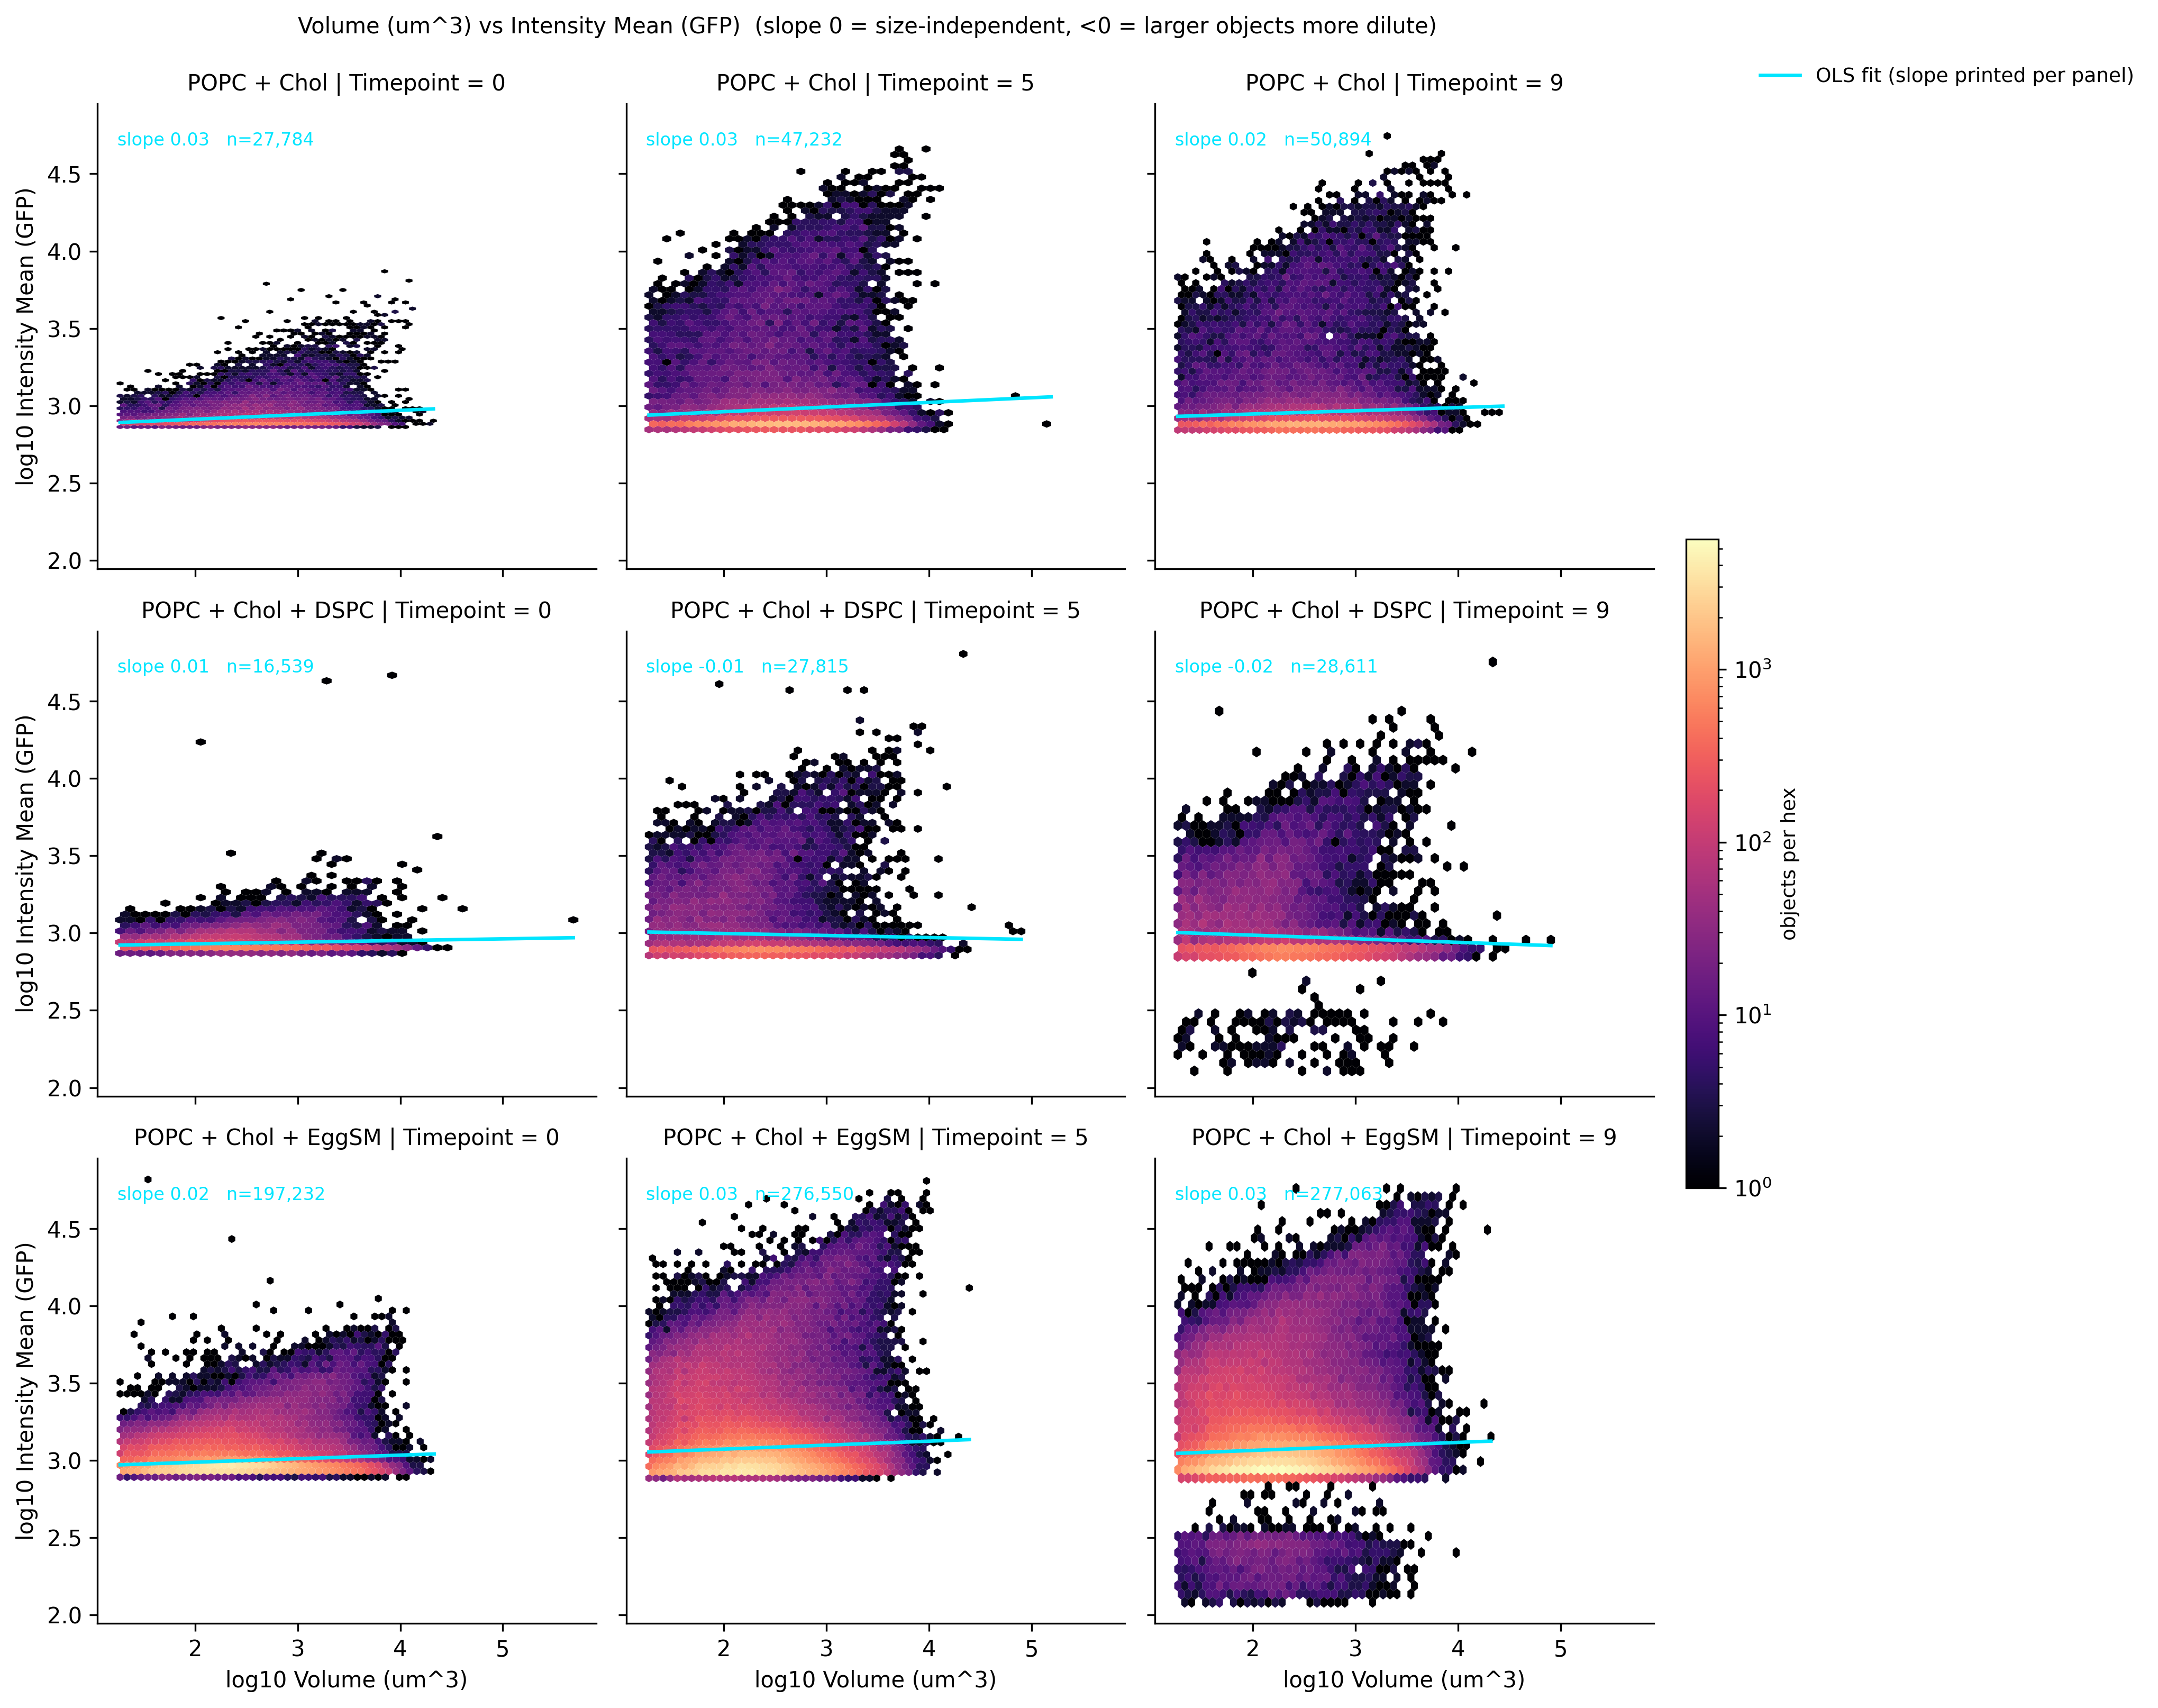
Old To be deprecated plotting functions
_ = m.plot_summary(data)_ = m.plot_size(data)Fogplots
_ = m.plot_fogplot(data)Output hidden; open in https://colab.research.google.com to view._ = m.plot_fogplot_compare(data)Output hidden; open in https://colab.research.google.com to view.%pip install zarr
%pip install cmapCollecting zarr
Downloading zarr-3.4.1-py3-none-any.whl.metadata (5.8 kB)
Collecting donfig>=0.8 (from zarr)
Downloading donfig-0.8.1.post1-py3-none-any.whl.metadata (5.0 kB)
Requirement already satisfied: google-crc32c>=1.5 in /usr/local/lib/python3.13/dist-packages (from zarr) (1.9.0)
Collecting msgspec>=0.19 (from zarr)
Downloading msgspec-0.22.0-cp313-cp313-manylinux2014_x86_64.manylinux_2_17_x86_64.manylinux_2_28_x86_64.whl.metadata (6.0 kB)
Collecting numcodecs>=0.16 (from zarr)
Downloading numcodecs-0.17.0-cp313-cp313-manylinux2014_x86_64.manylinux_2_17_x86_64.manylinux_2_28_x86_64.whl.metadata (3.2 kB)
Requirement already satisfied: numpy>=2 in /usr/local/lib/python3.13/dist-packages (from zarr) (2.1.3)
Requirement already satisfied: packaging>=22.0 in /usr/local/lib/python3.13/dist-packages (from zarr) (26.3)
Requirement already satisfied: typing-extensions>=4.14 in /usr/local/lib/python3.13/dist-packages (from zarr) (4.16.0)
Requirement already satisfied: pyyaml in /usr/local/lib/python3.13/dist-packages (from donfig>=0.8->zarr) (6.0.3)
Downloading zarr-3.4.1-py3-none-any.whl (405 kB)
━━━━━━━━━━━━━━━━━━━━━━━━━━━━━━━━━━━━━━━━ 405.3/405.3 kB 10.7 MB/s eta 0:00:00
Downloading donfig-0.8.1.post1-py3-none-any.whl (21 kB)
Downloading msgspec-0.22.0-cp313-cp313-manylinux2014_x86_64.manylinux_2_17_x86_64.manylinux_2_28_x86_64.whl (230 kB)
━━━━━━━━━━━━━━━━━━━━━━━━━━━━━━━━━━━━━━━━ 230.5/230.5 kB 14.8 MB/s eta 0:00:00
Downloading numcodecs-0.17.0-cp313-cp313-manylinux2014_x86_64.manylinux_2_17_x86_64.manylinux_2_28_x86_64.whl (1.4 MB)
━━━━━━━━━━━━━━━━━━━━━━━━━━━━━━━━━━━━━━━━ 1.4/1.4 MB 43.8 MB/s eta 0:00:00
Installing collected packages: numcodecs, msgspec, donfig, zarr
Successfully installed donfig-0.8.1.post1 msgspec-0.22.0 numcodecs-0.17.0 zarr-3.4.1
Collecting cmap
Downloading cmap-0.7.2-py3-none-any.whl.metadata (8.2 kB)
Requirement already satisfied: numpy in /usr/local/lib/python3.13/dist-packages (from cmap) (2.1.3)
Downloading cmap-0.7.2-py3-none-any.whl (995 kB)
━━━━━━━━━━━━━━━━━━━━━━━━━━━━━━━━━━━━━━━━ 995.9/995.9 kB 11.7 MB/s eta 0:00:00
Installing collected packages: cmap
Successfully installed cmap-0.7.2
import zarr
import matplotlib.pyplot as plt
from cmap import Colormap
import numpy as np

url = "https://data.nucleus.engineering/microscopy/nucleus-bnext-01/201009o_EsaR_mNG_0.1_0.5_K_L_2026-10-09_19-47-50.861429.zarr"
root = zarr.open_group(url, mode="r")
print(list(root.keys()))
['K', 'L']
from matplotlib.colors import LinearSegmentedColormap

gfp = LinearSegmentedColormap.from_list("gfp", ["black", "lime"])

wells = {
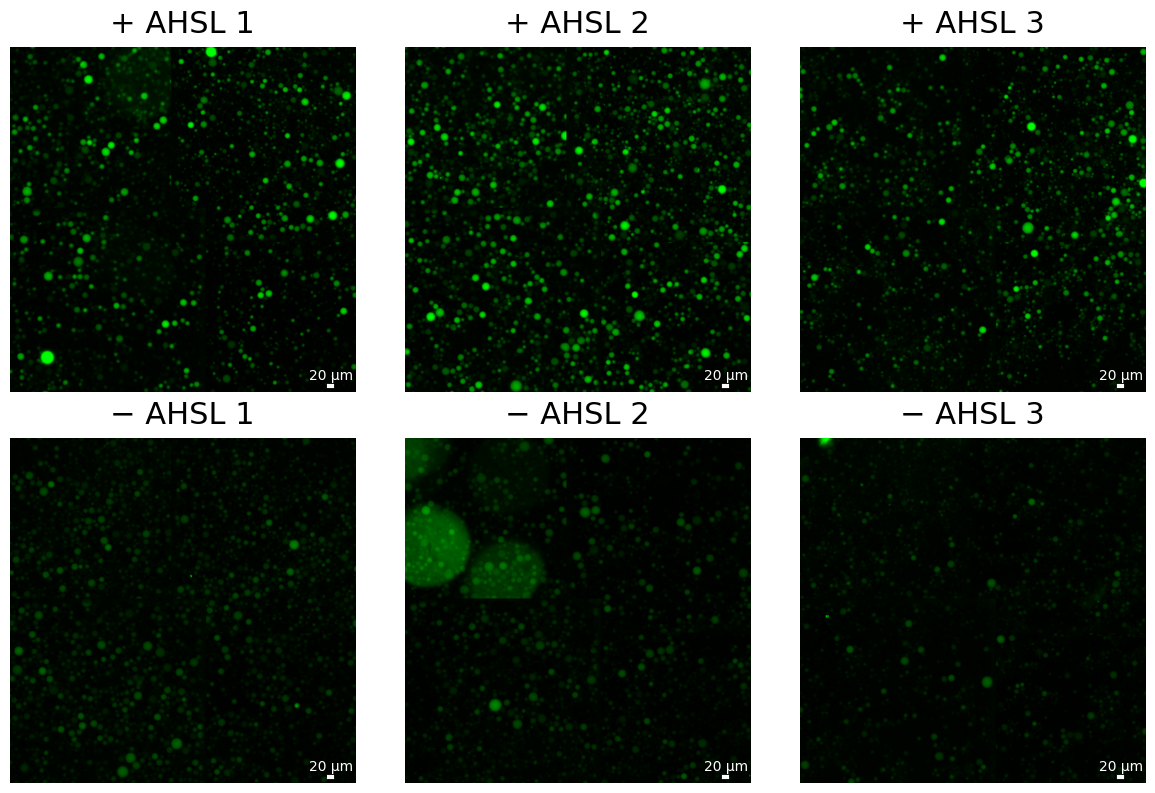
    ("K", "18"): "+ AHSL 1",
    ("K", "19"): "+ AHSL 2",
    ("K", "20"): "+ AHSL 3",
    ("L", "18"): "− AHSL 1",
    ("L", "19"): "− AHSL 2",
    ("L", "20"): "− AHSL 3",
}

TITLE_FONTSIZE = 22   # raise or lower to taste

fig, axes = plt.subplots(2, 3, figsize=(12, 8))
axes = axes.flatten()

y0, y1 = 4000, 7000
x0, x1 = 4000, 7000

px_um = 0.666  # µm per pixel at s1
bar_um = 20   # bar length in µm
bar_px = bar_um / px_um

for ax, ((row, col), name) in zip(axes, wells.items()):
    img = root[row][col]["0"]["s0"][-1, 0, 0, y0:y1, x0:x1]  # last timepoint, channel 0, z 0
    ax.imshow(img, cmap=gfp, vmin=1200, vmax=4500)
    ax.set_title(name, fontsize=TITLE_FONTSIZE, pad=10)
    ax.axis("off")
    x_end = (x1 - x0) - 200    # smaller number = closer to the right edge
    x_start = x_end - bar_px
    y_bar = (y1 - y0) - 50   # smaller number = closer to the bottom edge
    ax.plot([x_start, x_end], [y_bar, y_bar], color="white", lw=3)
    ax.text((x_start + x_end) / 2, y_bar - 60, f"{bar_um} µm", color="white", ha="center")

plt.tight_layout()
#plt.save_fig("MB_EsaR_GUVs_AHSL.png", dpi=600)

plt.show()