

CSHL Synthetic Biology 2026 – Week 1 DevCells Module
Abstract
Participants in the CSHL Synthetic Biology 2026 course’s Week 1 DevCells module used the PURExpress cell-free expression system to express the deGFP and mScarlet reporter proteins, then assembled PURExpress reactions into liposome-encapsulated synthetic cells. PURExpress bulk reactions showed successful in vitro protein synthesis of both reporters, while synthetic cells exhibited increasing green fluorescence over a 6-hour incubation, confirming active transcription and translation within the liposome compartments. This module established the foundational cell-free expression and synthetic-cell assembly skills applied to more advanced DevCells modules later in the course.
Introduction
The CSHL Synthetic Biology 2026 course brought together 16 participants with varied expertise and backgrounds from institutions across the world. Participants were divided into three groups—A, B, and C—to rotate through four research topics daily. One of these topics was Nanotechnology, which included sessions on DNA nanostructures, RNA circuits, and Developer Cells (DevCells). DevCells are non-living, genetically programmed biomolecular machines built from defined, purified parts. All designs, protocols, and software behind them are shared as open-source artifacts so labs can build on each other’s work rather than starting from scratch. This DevNote presents the experiments conducted by the three groups over three different days during Week 1 to build a foundational understanding of DevCells using the PURE system and bottom-up synthetic cells. The skills and knowledge acquired during the first week were later used to develop more sophisticated experiments and modules in Week 2.
Methods
Bill of Materials
Table 1:Bill of Materials
| Name | Product | Manufacturer | Storage Conditions |
|---|---|---|---|
| Energy Solution + E. coli tRNAs | Sol A | NEB (E6800) | -85 °C to -75 °C |
| PURE Protein Mix + E. coli Ribosomes | Sol B | NEB (E6800) | -85 °C to -75 °C |
| DNA template | pOpen-deGFP | b.next | -85 °C to -15 °C |
| RNAse Inhibitor, Murine | RNAse Inhibitor, Murine | NEB (M0314S) | -85 °C to -15 °C |
| Nuclease-free water | Nuclease-free water | ThermoFisher Scientific (AM9916) | 4 °C to 30 °C |
| PCR tubes | Thin-walled, RNase-free PCR tubes | ThermoFisher Scientific (AM12225) | Room temperature |
| Optical Adhesive Film | MicroAmp Optical Adhesive Film | ThermoFisher Scientific (4311971) | Room temperature |
| 384-well plate | 384 SV NoBind | Greiner Bio-One (784900) | Room temperature |
| Glucose | D-(+)-Glucose, 99.5% | Sigma-Aldrich (G8270-1KG) | Room temperature |
| Lipid-in-Oil Kit | 16:0-18:1 PC (POPC) + Cholesterol + Cy5.5 | b.next | 4 °C |
| 384-well glass bottom plates | 384-well glass bottom plates | Cellvis (P384-1.5H-N) | Room temperature |
| Optiprep | Optiprep | Serumwerk bernburg (1893) | Room temperature |
| Osmometer | Freezing-point osmometer | Advanced Micro-Osmometer Model 3300 | Room temperature |
Protocol
PURE Reaction Protocol
All components listed in the table below were removed from the -80 °C freezer and were thawed on ice.
The GFP or mScarlet fluorescence measurement protocol was loaded in the plate reader and it was preheated to 37 °C to measure protein expression kinetics.
The reaction setup was planned using the template below. A 35 µL reaction mastermix was prepared in a PCR tube on ice or a cold block.
Note: The reaction was prepared on ice or a cold block to prevent protein expression from starting during assembly. This ensured the plate reader captured the complete fluorescence kinetics for deGFP expression.
Table 2:Template for PURExpress Reaction composition
| Component | Stock Concentration | Unit | Final concentration | Unit | Volume for sample mastermix [µL] | Volume for negative control mastermix [µL] |
|---|---|---|---|---|---|---|
| Sol A | 2.5 | × | 1 | × | 14 | 14 |
| Sol B | 3.33 | x | 1 | x | 10.51 | 10.51 |
| RNAse Inhibitor | 40000 | U/mL | 2000 | U/mL | 1.75 | 1.75 |
| pOpen-deGFP DNA template | 60 | nM | 3 | nM | 1.75 | 0 |
| Nuclease-free water | — | — | — | — | 6.99 | 8.74 |
| Total mastermix volume [µL] | 35 | 35 |
The mastermix was mixed thoroughly by pipetting up and down 10–15 times until it appeared homogeneous and clear.
10 µL of the mastermix was aliquoted in triplicate into a 384-well plate for fluorescence measurement. The reactions were spaced with at least one empty well between them, and the mastermix was dispensed at the bottom of each well.
Note: The P20 pipette was set to 10.1 µL for the mastermix to be drawn, then it was dispensed into the plate well by the plunger being pushed to the first stop only—This prevented bubble generation.
Once all reactions were dispensed and the plate was ready for fluorescence measurement, it was sealed with an optical film to prevent evaporation.
deGFP or mScarlet fluorescence was measured in the plate reader while incubation at 37 °C was maintained.
Reagents were returned to their appropriate storage locations.
Synthetic Cell Protocol
The following protocol was used to prepare liposomes containing a PURExpress reaction that expresses deGFP using the pOpen-deGFP DNA template. Successfully assembled liposomes started dark and increased in green fluorescence over time as deGFP was produced. A simple sugar (glucose) solution was used for the outer solution to maintain osmolarity, as described in the sections below.
The protocol involved four key stages:
Table 3:Synthetic Cell Preparation Outline
| Stage | Process | Hands-on Time (hours) | Total Time (hours) | Notes |
|---|---|---|---|---|
| 1 | Prepare stock buffers and lipids | 1 | 4 | To save time, liposomes were prepared using pre-made lipid-in-oil kits from b.next. |
| 2 | Assemble PURE Reactions | 0.5 | 0.5 | — |
| 3 | Encapsulate reactions inside Liposomes | 0.5 | 0.5 | — |
| 4 | Measure and Image | 0.5 | 1-4 | Observe deGFP expression for 6 hours at room temperature. |
Step 1: Prepare Stock Buffers and Lipids
Pre-made lipids-in-oil kits from b.next were used; their composition is detailed below in the table below.
Table 4:Lipids-in-Oil Kit Composition
| Component | Target Percentage (%) | Molecular Weight (g/mol) | Stock concentration (mg/mL) | Volume to add (µL) |
|---|---|---|---|---|
| POPC | 70 | 760.076 | 25 | 162.17 |
| Cholesterol | 29.95 | 386.654 | 50 | 17.65 |
| Cy5.5 | 0.05 | 1366.32 | 1 | 4 |
Prepare sugar stock solution
Table 5:Composition of glucose stock solution
| Buffer | Target Concentration (M) | MW (kDa) | Weight (g) | Final Volume (mL) |
|---|---|---|---|---|
| 2M Glucose Stock | 2.0 | 180.16 | 3.6 | 10.0 |
2M glucose stock solution preparation:
3.60 g glucose and 8.0 mL ddH₂O were combined in a 50 mL tube.
Mixed vigorously until it was completely dissolved.
Additional ddH₂O was added to achieve a final volume of 10 mL.
Outer Solution Preparation
870 mM glucose outer solution was prepared using the 2M glucose stock solution.
The osmolarity was measured using an osmometer and, if necessary, the solution was diluted with water to achieve a final osmolarity of ~870 mmol/kg.
Step 2: Assemble PURExpress Reactions (Inner solution)
All components listed in the table below were removed from their appropriate cold storage and were thawed on ice.
The reaction setup was planned using the template below. A 30 µL reaction was prepared in a 1.5 mL tube on ice or a cold block.
Table 6:Setting up a PURE reaction using NEB PURExpress
| Component | Stock Concentration | Unit | Final concentration | Unit | Volume for sample mastermix [µL] | Volume for negative control mastermix [µL] |
|---|---|---|---|---|---|---|
| Sol A | 2.5 | × | 1 | × | 12 | 12 |
| Sol B | 3.33 | x | 1 | x | 9 | 9 |
| RNAse Inhibitor | 40000 | U/mL | 2000 | U/mL | 1.5 | 1.5 |
| pOpen-deGFP DNA template | 60 | nM | 3 | nM | 1.5 | 0 |
| Optiprep | 1.32 | mg/µL | 0.043 | mg/µL | 1 | 1 |
| Nuclease-free water | — | — | — | — | 5 | 6.5 |
| Total mastermix volume [µL] | 30 | 30 |
Mix the reaction thoroughly by pipetting up and down 10–15 times until it appears homogeneous and clear.
Hold assembled reactions on ice until ready for encapsulation.
Step 3: Encapsulate PURE Reactions into Liposomes

Figure 1:Schematic representation of emulsion phase transfer method for assembling synthetic cells. Image from Liposomes 101 available at: https://
A 1.5 mL tube rack was set up with two 1.5 mL microcentrifuge tubes for each liposome encapsulation. The tubes were numbered according to the number of reactions assembled in Step 2. The two tubes for each reaction were labeled:
T—transfer
L—liposomes
300 µL of 870 mmol/kg glucose outer solution was added to each of the tubes labelled T.
150 µL of the lipids-in-oil mixture was added on top of each PURE reaction assembled in Step 2.
The lipids-in-oil and PURE reaction were emulsified by running the tube along a row of empty slots on the 1.5 mL tube rack 20–30 times, until a stable emulsion with an even milky color was formed.
Each emulsion was immediately layered over the transfer solution. The entire emulsion was slowly pipetted down the side of the corresponding T tube.
T tubes were centrifuged at 9000 g for 10 min at room temperature to pellet the liposomes. The hinges of each T tube were oriented outward in the centrifuge rotor to mark the pellet’s location.
The liposomes were extracted from each T tube:
The oil layer and lipid debris were removed from the top of each T tube by gently pipetting with a P1000 pipette first and then using P200 to remove the residual oil.
Liposomes were gently extracted by pipetting 50 µL of pellet and outer solution from beside the pellet location.
The 50 µL liposome sample was added to the respective liposome tube, L.
Liposomes were held on ice until the measurement was ready to be started.
The liposomes were pipetted into a well on a 384-well glass bottom plate.
Reagents were returned to their appropriate storage locations.
Step 4: Image Liposomes
The microscope and camera were turned on, and the imaging software “Squid” was launched. Imaging conditions were set up for brightfield, GFP fluorescence (488 nm excitation), and Cy5.5 fluorescence (638 nm excitation).
The plate was placed on the microscope, and focus was found by adjusting to the edge of a single well in brightfield. A well containing a sample of interest was located.
The system was switched to Cy5.5/red fluorescence imaging. Focus was found on liposomes just above the coverslip by backing the focus out until an entire field of liposomes appeared to lose focus simultaneously, then slowly moving back in until the liposomes were in sharp focus.
Images of liposomes were captured using a time-series, with images taken every 10 minutes for 6 hours.
Results
PURExpress Bulk Reactions
Group B and Group C assembled the PURExpress reactions expressing deGFP and mScarlet proteins, respectively, from their corresponding DNA templates. T7-mScarlet linear DNA template was used to express mScarlet protein and pOpen-deGFP plasmid was used to express deGFP. In addition, a negative control reaction without the DNA template was included as a negative control for both experiments.
The composition of the reactions for both mScarlet and deGFP expression experiments are given in the tables below. A 35 μL mastermix was prepared for each reaction by each participant, and 10 μL aliquots were dispensed in triplicate into a 384-well plate for fluorescence measurements.
Table 7:Group C PURExpress Reaction compositions expressing mScarlet protein
| Component | Input concentration | Unit | Final concentration | Unit | Volume for one reaction [µL] | Volume for negative control reaction [µL] |
|---|---|---|---|---|---|---|
| Sol A | 2.50 | × | 1 | × | 14.00 | 14.00 |
| Sol B | 3.33 | x | 1.00 | x | 10.51 | 10.51 |
| T7-mScarlet | 100 | nM | 3 | nM | 1.05 | 0 |
| RNAse Inhibitor | 40000 | U/ml | 2000 | U/ml | 1.75 | 1.75 |
| Water | — | — | — | — | 7.69 | 8.74 |
| Total | 35 | 35 |
Table 8:Group B PURExpress Reaction compositions expressing deGFP protein
| Component | Input concentration | Unit | Final concentration | Unit | Volume for one reaction [µL] | Volume for negative control reaction [µL] |
|---|---|---|---|---|---|---|
| Sol A | 2.50 | × | 1 | × | 14.00 | 14.00 |
| Sol B | 3.33 | x | 1.00 | x | 10.51 | 10.51 |
| pOpen-deGFP DNA | 60 | nM | 3 | nM | 1.75 | 0 |
| RNAse Inhibitor | 40000 | U/ml | 2000 | U/ml | 1.75 | 1.75 |
| Water | — | — | — | — | 6.99 | 8.74 |
| Total | 35 | 35 |

Figure 2:PURExpress reactions from Group C expressing mScarlet protein from a linear DNA template. The reaction plate was incubated at 37 °C in a plate reader, with fluorescence measurements (Excitation: 569 nm, Emission: 594 nm, Gain: 50) recorded every 5 minutes over a 6-hour period.

Figure 3:PURExpress reactions from Group B expressing deGFP protein from a plasmid DNA template. The reaction plate was incubated at 37 °C in a plate reader, with fluorescence measurements (Excitation: 485 nm, Emission: 528 nm, Gain: 75) recorded every 5 minutes over a 6-hour period. 10 μL of 1 μM fluorescein was included in triplicate as a fluorescence standard.

Figure 4:Fluorescence normalized to 1 μM Fluorescein for PURExpress reactions from Group B expressing deGFP protein from a plasmid DNA template.
Participants in Groups B and C successfully performed in vitro protein synthesis using the PURExpress system. The resulting raw time-series data from the plate reader was analyzed using the Nucleus Cell Developer Kit (CDK). Variances in final protein yield were observed among participants, likely due to differences in pipetting technique.
Synthetic Cells
PURExpress reactions were encapsulated inside liposomes to prepare synthetic cells expressing deGFP. Synthetic cells were prepared by Group A and Group B using the protocol described in the methods section of this DevNote.
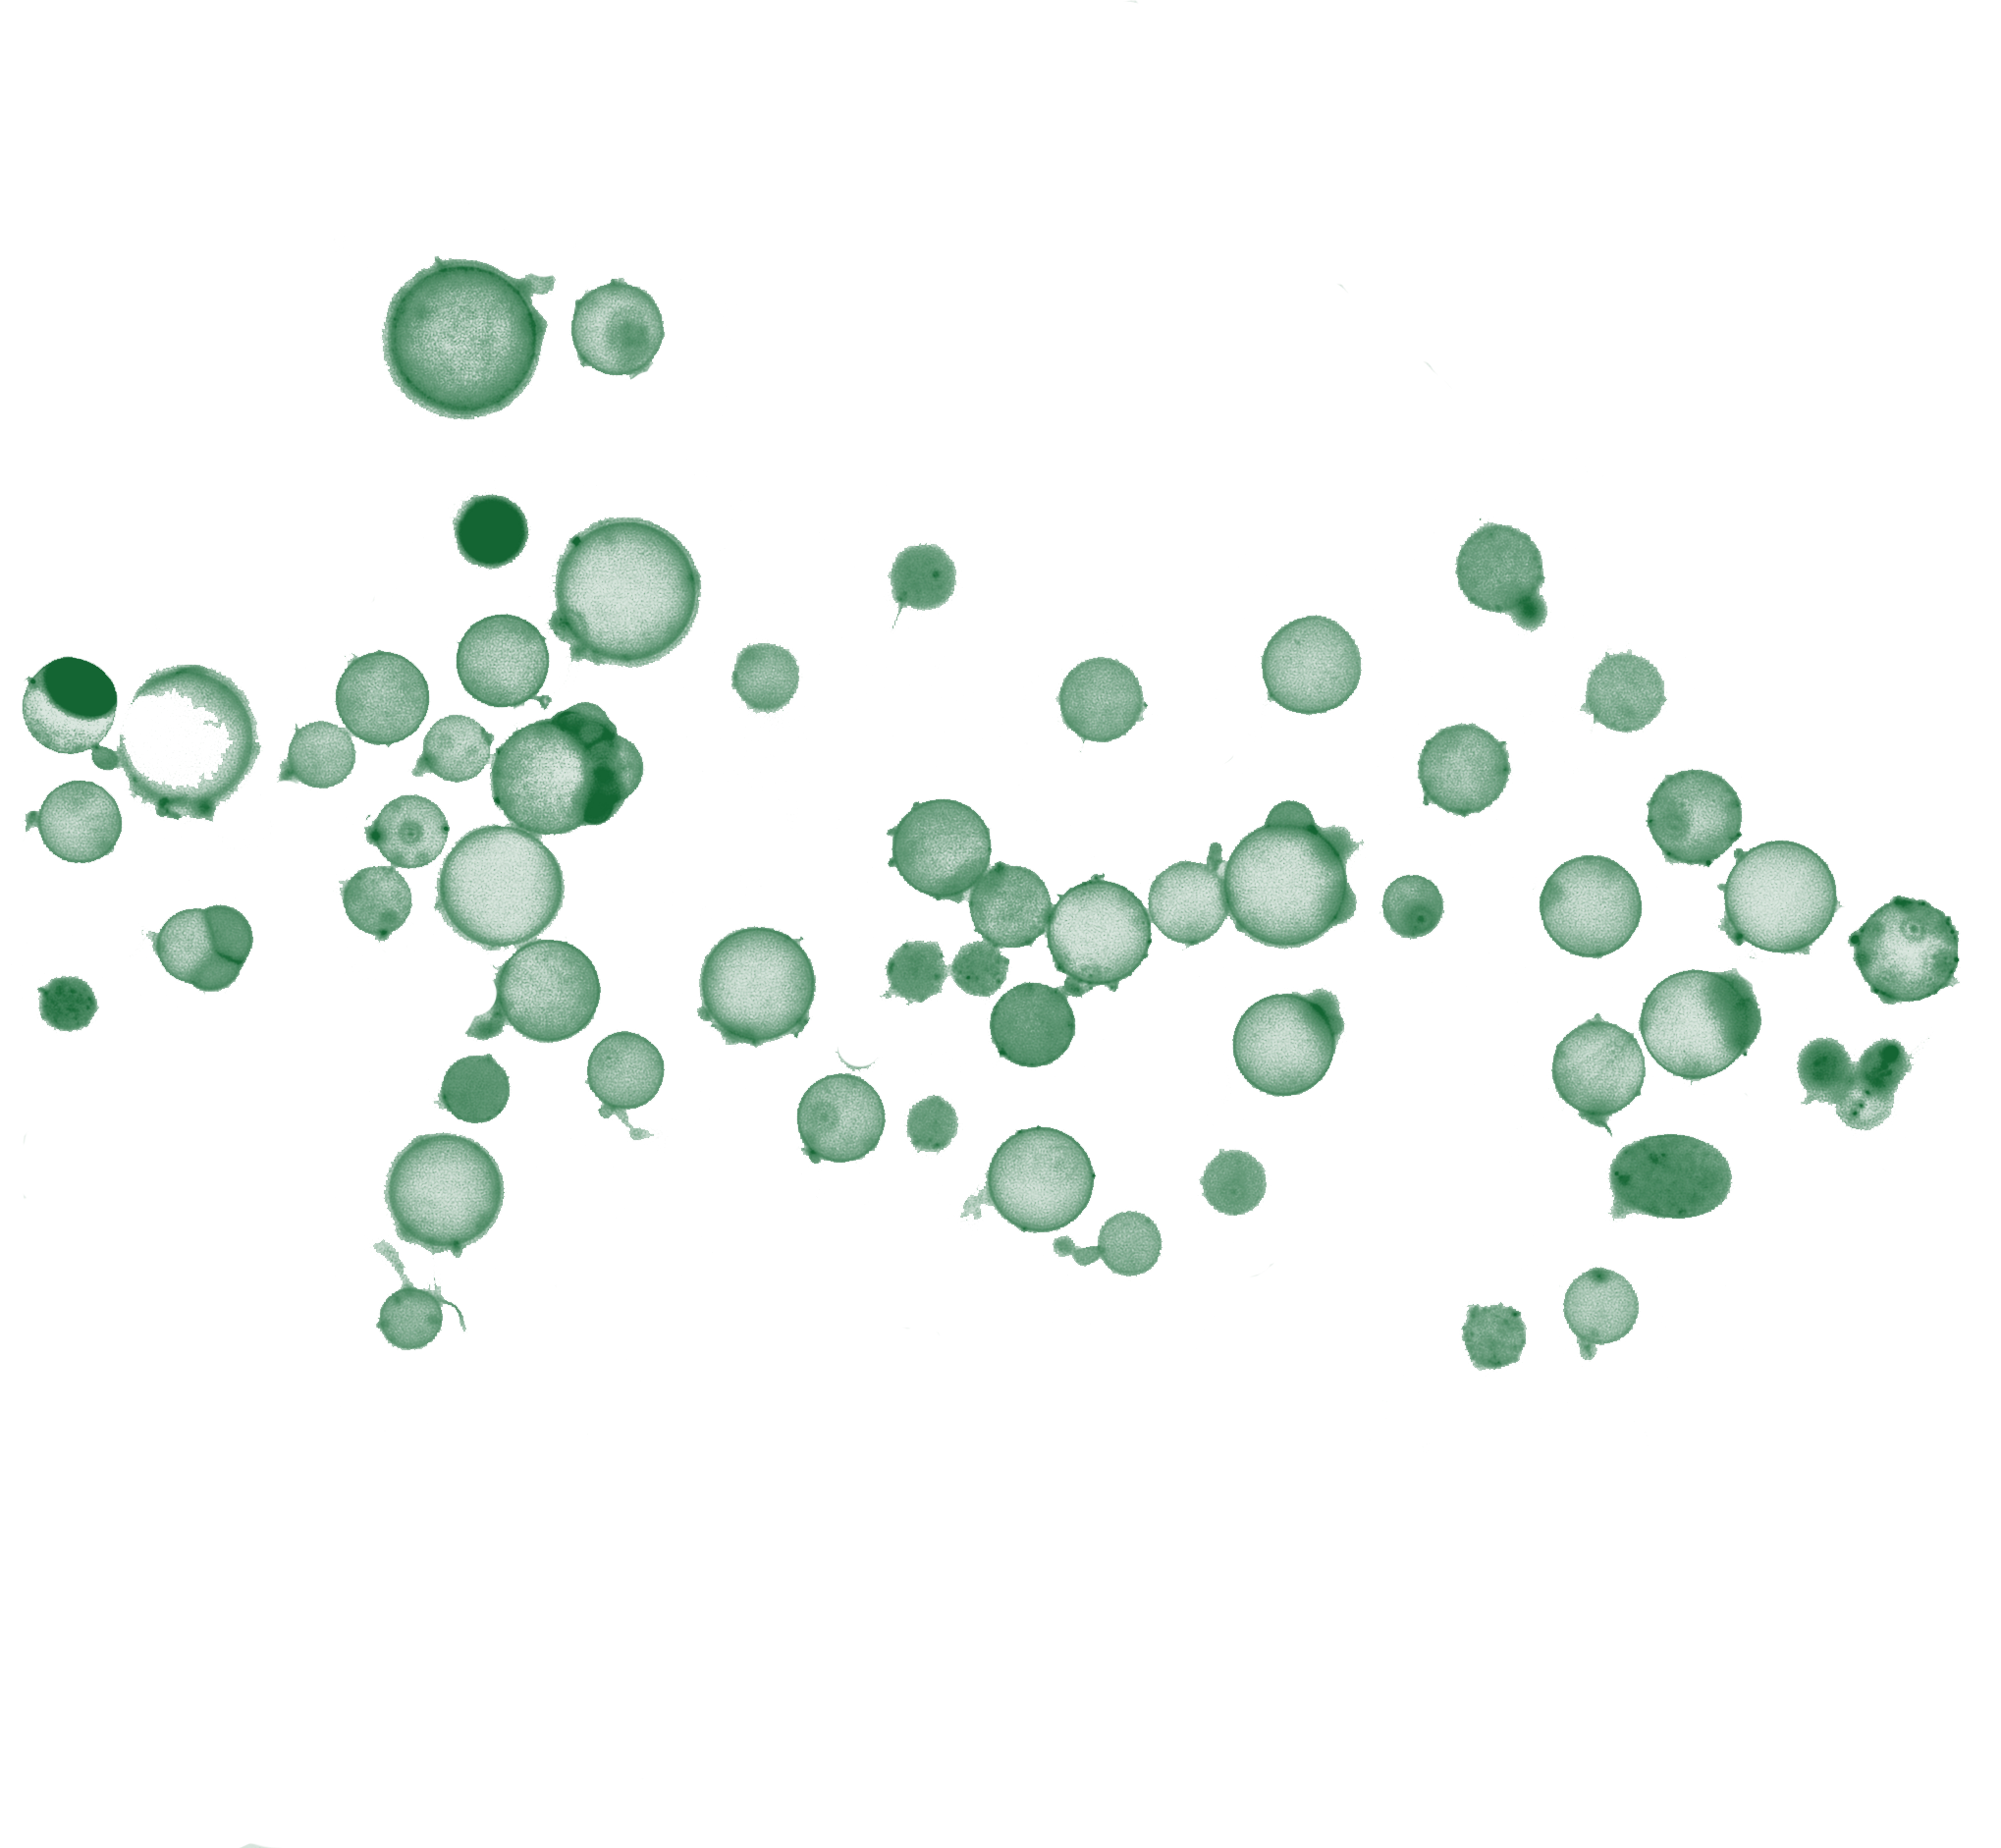
Preparations that successfully formed liposomes were observed using the Cephla Squid+ microscope at room temperature, with time-series measurements captured to track deGFP expression. Representative images from the beginning of the experiment and following a 6-hour incubation are provided in Figures 5-10. The imaging setup utilized the 488 nm channel for deGFP and the 638 nm channel for Cy5.5 detection. While minimal deGFP signal was found within the synthetic cells at the initial time point (t = 0), a significant proportion of the population showed bright green fluorescence by the final time point (t = 6 hours). This confirms that protein synthesis occurred from the DNA template via active transcription and translation within the liposome compartments.

Figure 5:Synthetic cells, t = 0 hours. Integrated fluorescence channels for green (488 nm) and red (638 nm) wavelengths. The initial measurement (t = 0) was recorded 30 minutes following inner solution assembly, accounting for the duration of the liposome encapsulation process.

Figure 6:Synthetic cells, t = 6 hours. Integrated fluorescence channels for green (488 nm) and red (638 nm) wavelengths. The initial measurement (t = 0) was recorded 30 minutes following inner solution assembly, accounting for the duration of the liposome encapsulation process.

Figure 7:Synthetic cells, t = 0 hours. Integrated fluorescence channels for green (488 nm) and red (638 nm) wavelengths. The initial measurement (t = 0) was recorded 30 minutes following inner solution assembly, accounting for the duration of the liposome encapsulation process.

Figure 8:Synthetic cells, t = 6 hours. Integrated fluorescence channels for green (488 nm) and red (638 nm) wavelengths. The initial measurement (t = 0) was recorded 30 minutes following inner solution assembly, accounting for the duration of the liposome encapsulation process.

Figure 9:Synthetic cells, t = 0 hours. Integrated fluorescence channels for green (488 nm) and red (638 nm) wavelengths. The initial measurement (t = 0) was recorded 30 minutes following inner solution assembly, accounting for the duration of the liposome encapsulation process.

Figure 10:Synthetic cells, t = 6 hours. Integrated fluorescence channels for green (488 nm) and red (638 nm) wavelengths. The initial measurement (t = 0) was recorded 30 minutes following inner solution assembly, accounting for the duration of the liposome encapsulation process.

Figure 11:The raw fluorescence data from Group B’s synthetic cells, containing the pOpen-deGFP plasmid, was processed to evaluate expression kinetics. For the majority of samples, the mean fluorescence intensity exhibited a temporal increase, although wells H8 and H9 proved to be notable exceptions. Significant variations in the total population count across different wells were observed, reflecting the inherent stochasticity of individual liposome preparations performed by different participants.
Conclusions and next steps
The DevCells module of the CSHL Synthetic Biology 2026 course provided participants with a hands-on workshop in bottom-up synthetic cell preparation. The technical proficiency and protocols acquired during Week 1 were subsequently applied to the development and characterization of sophisticated experimental modules in Week 2, such as the tetR-aTc sensing module, Cx43 membrane translation module, and DNA nanopore membrane integration module.
Participants
Corynne Stepjanie A. Adanho (UC Berkeley), Georgina Canto-Encalada (San Diego State University), Samuel Chen (University of Michigan), Hyungrok Choi (KRIBB), Sonja Danon (University of Michigan), Manuela Frias Gomez (Purdue University), Gabriela Garza (University of Michigan), Leopold Green (Purdue University), Sushmita Halder (Carnegie Mellon University), Dwon Jordana (University of Pittsburgh), Ravi Kalathur (St Jude Children’s Res Hospital), Lukas Kneuer (TU Hamburg), Katherine Larina (Cornell University), Luis Montalvo-Gonzalez (Purdue University), Sergio Rengifo-Lozano (National University of Trujillo), Samuel Schaffter (NIST), Maobing Tu (University of Cincinnati), and Surendra Yadav (b.next).