


Load data — Group A, Jul 24
from google.colab import drive
import sys

try:
    import cdk
    print("CDK already installed, skipping installation and restart.")
except ImportError:
    !pip install nucleus-cdk==0.6.0rc2 -q
    print("\nInstallation complete. Restarting runtime to refresh dependencies...")
    import os
    os._exit(0)
CDK already installed, skipping installation and restart.
import pandas as pd
import seaborn as sns
import matplotlib.pyplot as plt

from cdk import logging
log = logging.setup_logging(logging.INFO)

# Import the cdk platereader module
from cdk.instruments import platereader as pr
INFO:cdk.logging:Logging initialized
import sys
sys.path
['/content',
'/env/python',
'/usr/lib/python312.zip',
'/usr/lib/python3.12',
'/usr/lib/python3.12/lib-dynload',
'',
'/usr/local/lib/python3.12/dist-packages',
'/usr/lib/python3/dist-packages',
'/usr/local/lib/python3.12/dist-packages/IPython/extensions',
'/root/.ipython']# import sys
# !pip install --upgrade scipy
from cdk.analysis.cell import microscopy as mLoad data — Group A, Jul 24
Will put a proper read parquet in the actual microscopy CDK code. Once that’s done there’s a load function that will also take a platemap (like the the platereader).
data = pd.read_parquet(
    "https://data.nucleus.engineering/microscopy/20260724-CSHL-GroupA_2026-07-24_15-52-34.173406.parquet",
    storage_options={
        "User-Agent": "Mozilla/5.0 (X11; Linux x86_64) AppleWebKit/537.36 "
                      "(KHTML, like Gecko) Chrome/124.0 Safari/537.36"
    }
)

# data = data.merge(platemap, on="Well")
# data = data.sort_values(by=["Experiment", "Name", "Timepoint"])
Summary Plots
filtered_data = data[data['Well'].isin(['J8', 'J9', 'J10', 'J11', 'J12', 'J13'])]
m.plot_summary(filtered_data)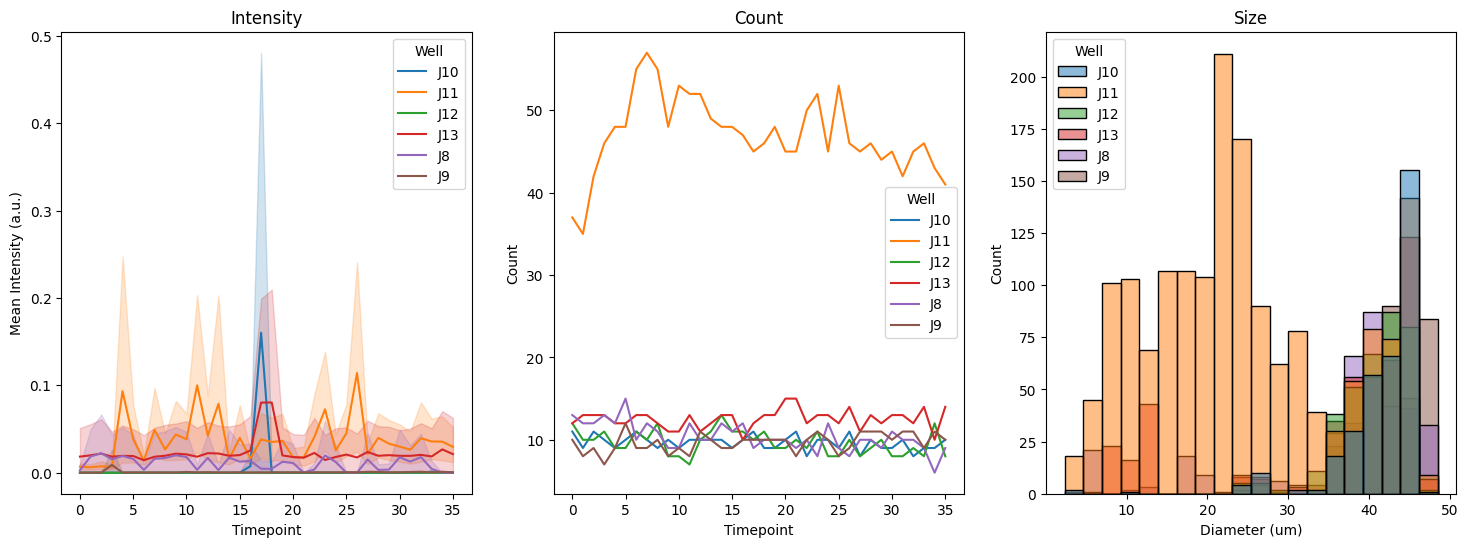
plt.figure(figsize=(12, 6))
sns.lineplot(data=filtered_data, x='Timepoint', y='Intensity Mean (GFP)', hue='Well')
plt.title('Intensity Mean (GFP) vs Timepoint for Wells J8-J13')
plt.xlabel('Timepoint')
plt.ylabel('Intensity Mean (GFP)')
plt.grid(True, linestyle='--', alpha=0.7)
plt.show()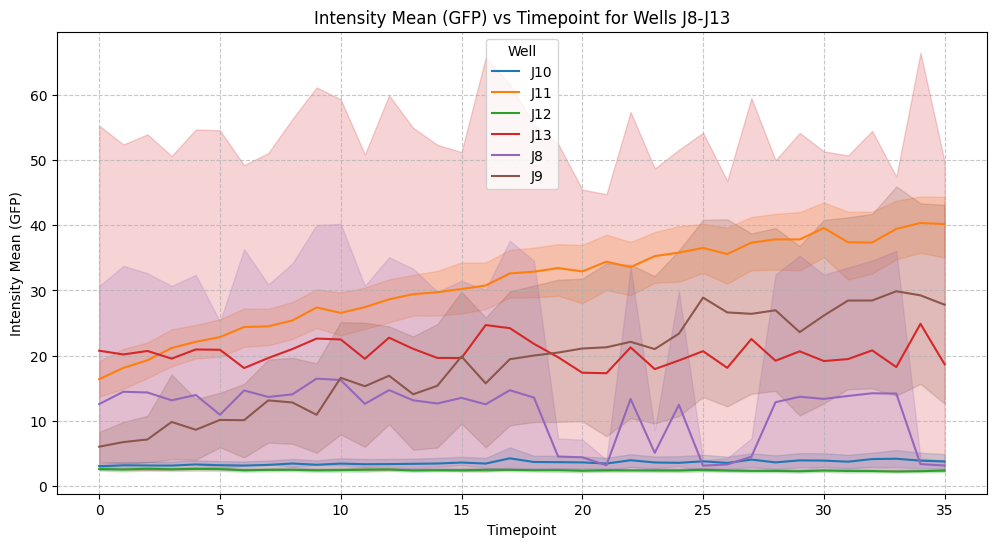
print(data.columns.tolist())['Label', 'Area (um^2)', 'Diameter (Equivalent) (um)', 'Diameter (Feret) (um)', 'Length Major (um)', 'Length Minor (um)', 'Perimeter (um)', 'Intensity Mean (GFP)', 'Intensity Mean (Rhodamine)', 'Intensity Mean (Alexa Fluor 647)', 'Intensity Max (GFP)', 'Intensity Max (Rhodamine)', 'Intensity Max (Alexa Fluor 647)', 'Intensity STD (GFP)', 'Intensity STD (Rhodamine)', 'Intensity STD (Alexa Fluor 647)', 'Intensity Min (GFP)', 'Intensity Min (Rhodamine)', 'Intensity Min (Alexa Fluor 647)', 'Eccentricity', 'Centroid', 'Centroid.1', 'Volume (um^3)', 'Circularity', 'Intensity Sum (GFP)', 'Intensity Norm (GFP)', 'Intensity Sum (Rhodamine)', 'Intensity Norm (Rhodamine)', 'Intensity Sum (Alexa Fluor 647)', 'Intensity Norm (Alexa Fluor 647)', 'Timepoint', 'Dataset', 'Well']