Load the data
!pip install nucleus-cdk==0.5.0rc2 | tail -n2

# Surface a failed install here, rather than as a confusing ModuleNotFoundError
# in the import cell below.
import importlib.metadata as md
assert md.version("nucleus-cdk") == "0.5.0rc2", f"got {md.version('nucleus-cdk')}"
Requirement already satisfied: urllib3<3,>=1.21.1 in /opt/homebrew/Caskroom/miniforge/base/lib/python3.12/site-packages (from requests->panel>=1.0->hvplot<0.12.0,>=0.11.1->nucleus-cdk==0.5.0rc2) (2.5.0)
Requirement already satisfied: certifi>=2017.4.17 in /opt/homebrew/Caskroom/miniforge/base/lib/python3.12/site-packages (from requests->panel>=1.0->hvplot<0.12.0,>=0.11.1->nucleus-cdk==0.5.0rc2) (2025.11.12)
import pandas as pd
import matplotlib.pyplot as plt
import seaborn as sns

from cdk.analysis.cytosol import platereader as pr

# Initialize plotting
pr.plot_setup()
Load the data
Provide a CSV file containing the data, and a platemap. This function returns both the data with the plate map mapped to it, and the platemap by itself, which is useful for certain tasks.
data_file = "data/20251105-labcraft-energy-sweep-01-biotek-cdk.txt"
platemap_file = "data/labcraft-platemap.csv"

data = pr.load_platereader_data(data_file)
data = data[data["Read"] == "GFP-G35"]
data = data.dropna()data.Well.unique()array(['A1', 'A2', 'A3', 'A4', 'A5', 'A6', 'B1', 'B2', 'B3', 'B4', 'B5',
'B6', 'C1', 'C2', 'C3', 'C4', 'C5', 'C6', 'D1', 'D2', 'D3', 'D4',
'D5', 'D6', 'E1', 'E2', 'E3', 'E4', 'E5', 'E6', 'F1', 'F2', 'F3',
'F4', 'F5', 'F6', 'G1', 'G2', 'G3', 'G4', 'G5', 'G6', 'H1', 'H2',
'H3', 'H4', 'H5', 'H6', 'I1', 'I2', 'I3', 'I4', 'I5', 'I6', 'J1',
'J2', 'J3', 'J4', 'J5', 'J6', 'K1', 'K2', 'K3', 'K4', 'K5', 'K6',
'L1', 'L2', 'L3', 'L4', 'L5', 'L6', 'M1', 'M2', 'M3', 'M4', 'M5',
'M6', 'N1', 'N2', 'N3', 'N4', 'N5', 'N6', 'O1', 'O2', 'O3', 'O4',
'O5', 'O6', 'P1', 'P2', 'P3', 'P4', 'P5', 'P6'], dtype=object)data[data.Well == "L5"]Loading...
platemap = pd.read_csv(platemap_file)

for values, g in platemap.groupby(['Mg Vol (droplets)', 'K Vol (droplets)', 'Water Vol (droplets)']):
    mg, k, water = values
    name = f"Mg {mg}; K {k}"
    platemap.loc[g.index, "Name"] = name

platemap['Type'] = "Sample"

controls = pd.DataFrame(['D5', 'E5', 'F5', 'G5', 'H5', 'I5','J5','K5','L5','M5','N5','O5'], columns=['Well'])
controls['Name'] = [*["1 uM fresh HPTS"]*4, *["10 uM frozen HPTS"]*4, *["10 uM fresh HPTS"]*4]
controls['Type'] = "Standard"


platemap = pd.concat([platemap, controls], ignore_index=True)platemap.Well.unique()array(['A1', 'A2', 'A3', 'B1', 'B2', 'B3', 'C1', 'C2', 'C3', 'D1', 'D2',
'D3', 'E1', 'E2', 'E3', 'E4', 'F1', 'F2', 'F3', 'F4', 'G1', 'G2',
'G3', 'G4', 'H1', 'H2', 'H3', 'H4', 'I1', 'I2', 'I3', 'I4', 'J1',
'J2', 'J3', 'J4', 'K1', 'K2', 'K3', 'K4', 'L1', 'L2', 'L3', 'L4',
'M1', 'M2', 'M3', 'M4', 'N1', 'N2', 'N3', 'N4', 'O1', 'O2', 'O3',
'O4', 'P1', 'P2', 'P3', 'P4', 'D5', 'E5', 'F5', 'G5', 'H5', 'I5',
'J5', 'K5', 'L5', 'M5', 'N5', 'O5'], dtype=object)conc = pd.read_csv("data/concentration_key.csv")
conc.columns = ["Well", "[Mg] (mM)", "[K] (mM)", "Water"]
platemap_full = platemap.merge(conc, how="outer")
platemap_full = platemap_full.drop(columns=['K Vol (droplets)', 'Water Vol (droplets)', "Completed", "Water"])
new_columns = {
"HEPES": 50,
"ATP": 2,
"GTP": 2,
"CTP": 1,
"UTP": 1,
"Creatine phosphate": 20,
"TCEP": 1,
"Folinic acid": 0.02,
"Spermidine": 2,
"Amino Acid solution": 0.3,
"tRNA": 3.5,
"DNA":5,
"Product":"plamGFP",
"PPK":0,
}
platemap_full = platemap_full.assign(**new_columns)
platemap_full.to_csv("full_platemap_cleaned.csv")platemap.Well.unique()array(['A1', 'A2', 'A3', 'B1', 'B2', 'B3', 'C1', 'C2', 'C3', 'D1', 'D2',
'D3', 'E1', 'E2', 'E3', 'E4', 'F1', 'F2', 'F3', 'F4', 'G1', 'G2',
'G3', 'G4', 'H1', 'H2', 'H3', 'H4', 'I1', 'I2', 'I3', 'I4', 'J1',
'J2', 'J3', 'J4', 'K1', 'K2', 'K3', 'K4', 'L1', 'L2', 'L3', 'L4',
'M1', 'M2', 'M3', 'M4', 'N1', 'N2', 'N3', 'N4', 'O1', 'O2', 'O3',
'O4', 'P1', 'P2', 'P3', 'P4', 'D5', 'E5', 'F5', 'G5', 'H5', 'I5',
'J5', 'K5', 'L5', 'M5', 'N5', 'O5'], dtype=object)data.Well.unique()array(['A1', 'A2', 'A3', 'A4', 'A5', 'A6', 'B1', 'B2', 'B3', 'B4', 'B5',
'B6', 'C1', 'C2', 'C3', 'C4', 'C5', 'C6', 'D1', 'D2', 'D3', 'D4',
'D5', 'D6', 'E1', 'E2', 'E3', 'E4', 'E5', 'E6', 'F1', 'F2', 'F3',
'F4', 'F5', 'F6', 'G1', 'G2', 'G3', 'G4', 'G5', 'G6', 'H1', 'H2',
'H3', 'H4', 'H5', 'H6', 'I1', 'I2', 'I3', 'I4', 'I5', 'I6', 'J1',
'J2', 'J3', 'J4', 'J5', 'J6', 'K1', 'K2', 'K3', 'K4', 'K5', 'K6',
'L1', 'L2', 'L3', 'L4', 'L5', 'L6', 'M1', 'M2', 'M3', 'M4', 'M5',
'M6', 'N1', 'N2', 'N3', 'N4', 'N5', 'N6', 'O1', 'O2', 'O3', 'O4',
'O5', 'O6', 'P1', 'P2', 'P3', 'P4', 'P5', 'P6'], dtype=object)data = data.merge(platemap)
data = data.merge(conc, how="outer")data.Well.unique()array(['A1', 'A2', 'A3', 'B1', 'B2', 'B3', 'C1', 'C2', 'C3', 'D1', 'D2',
'D3', 'D5', 'E1', 'E2', 'E3', 'E4', 'E5', 'F1', 'F2', 'F3', 'F4',
'F5', 'G1', 'G2', 'G3', 'G4', 'G5', 'H1', 'H2', 'H3', 'H4', 'H5',
'I1', 'I2', 'I3', 'I4', 'I5', 'J1', 'J2', 'J3', 'J4', 'J5', 'K1',
'K2', 'K3', 'K4', 'K5', 'L1', 'L2', 'L3', 'L4', 'L5', 'M1', 'M2',
'M3', 'M4', 'M5', 'N1', 'N2', 'N3', 'N4', 'N5', 'O1', 'O2', 'O3',
'O4', 'O5', 'P1', 'P2', 'P3', 'P4'], dtype=object)Basic Analysis
Curves
Curves of RFU over time, by named sample.
data[data.Name == "10 uM fresh HPTS"]Loading...
pr.plot_curves(data) #, hue="Well")<seaborn.axisgrid.FacetGrid at 0x10d5549b0>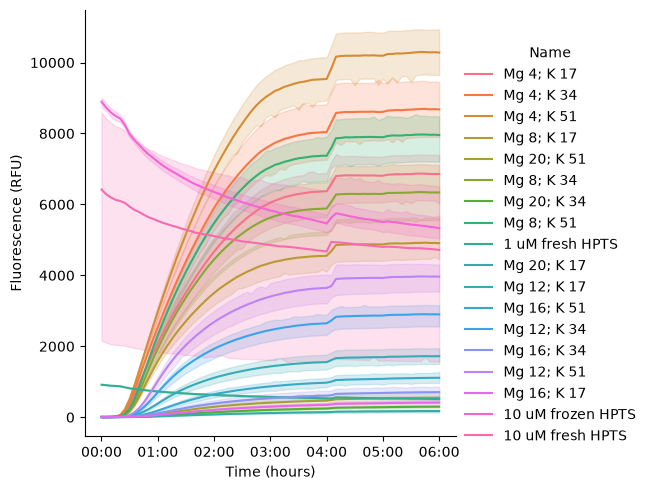
data.Name.unique()array(['Mg 4; K 17', 'Mg 4; K 34', 'Mg 4; K 51', 'Mg 8; K 17',
'Mg 20; K 51', 'Mg 8; K 34', 'Mg 20; K 34', 'Mg 8; K 51',
'1 uM fresh HPTS', 'Mg 20; K 17', 'Mg 12; K 17', 'Mg 16; K 51',
'Mg 12; K 34', 'Mg 16; K 34', 'Mg 12; K 51', 'Mg 16; K 17',
'10 uM frozen HPTS', '10 uM fresh HPTS'], dtype=object)pr.plot_curves(data, hue="[Mg] (mM)", col="[K] (mM)", palette="viridis")<seaborn.axisgrid.FacetGrid at 0x10f5155b0>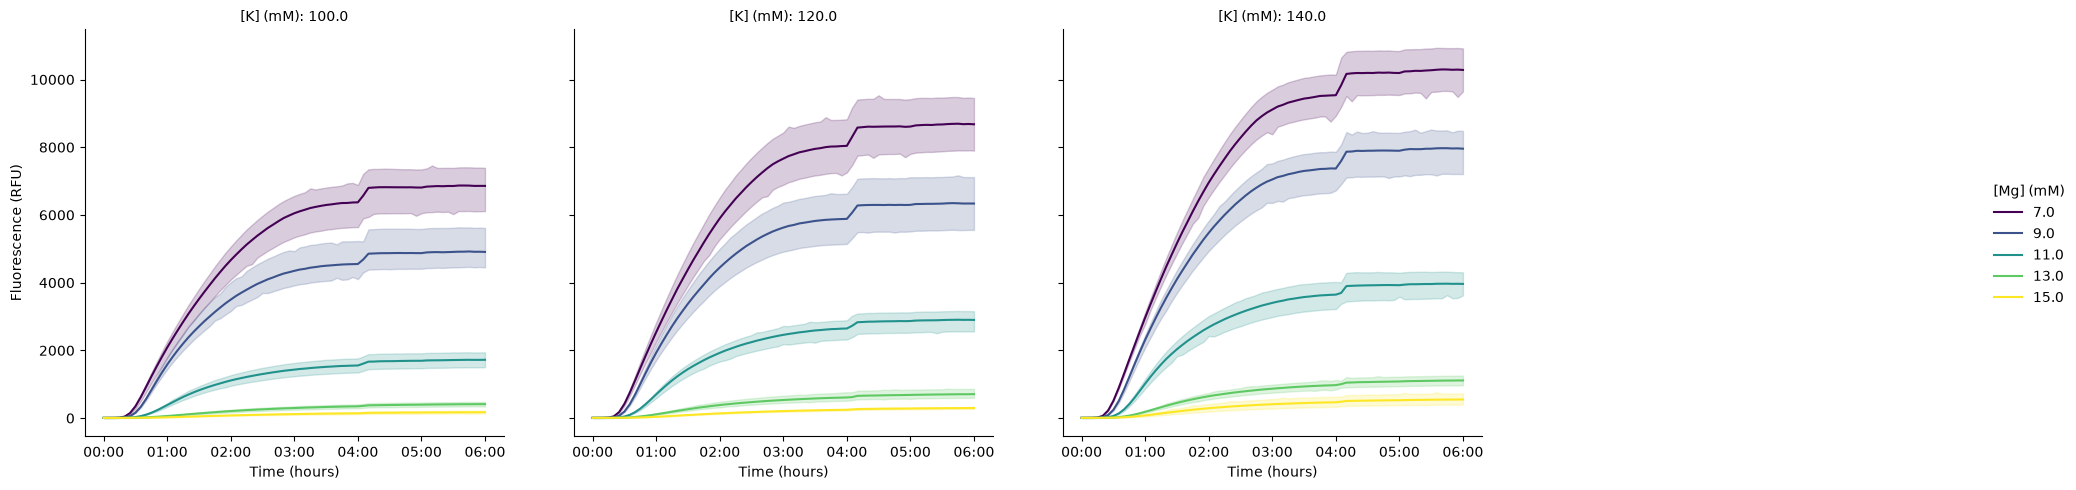
Steady state
Bar graph of steady-state endpoint of each sample. Steady state is calculated as the maximum fluorescence value over a 3-sample rolling average on the data.
pr.plot_steadystate(data)<seaborn.axisgrid.FacetGrid at 0x102fe2fc0>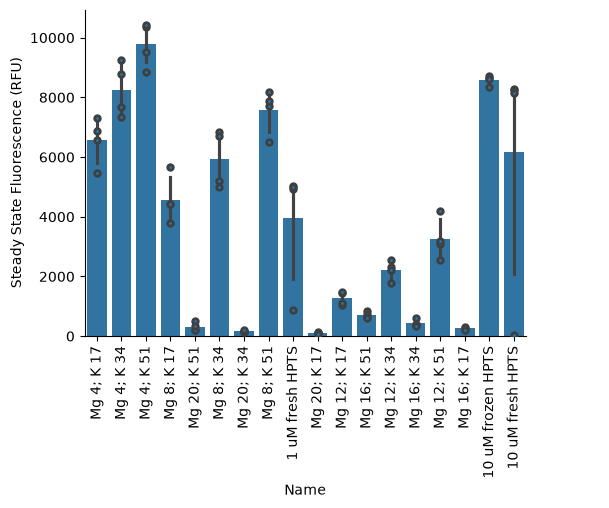
kinetics = pr.kinetic_analysis(data, group_by=["Well", "Read", "[Mg] (mM)", "[K] (mM)", "Experiment"])kinetics.head()Loading...
kinetics.to_csv("Mg_K_screen_20251105_fits.csv")ss = kinetics["Steady State"]["Data"].reset_index().merge(platemap).merge(conc)
sns.catplot(
data=ss,
x="[Mg] (mM)",
y="Data",
col="[K] (mM)",
kind="bar"
)<seaborn.axisgrid.FacetGrid at 0x10f1fc560>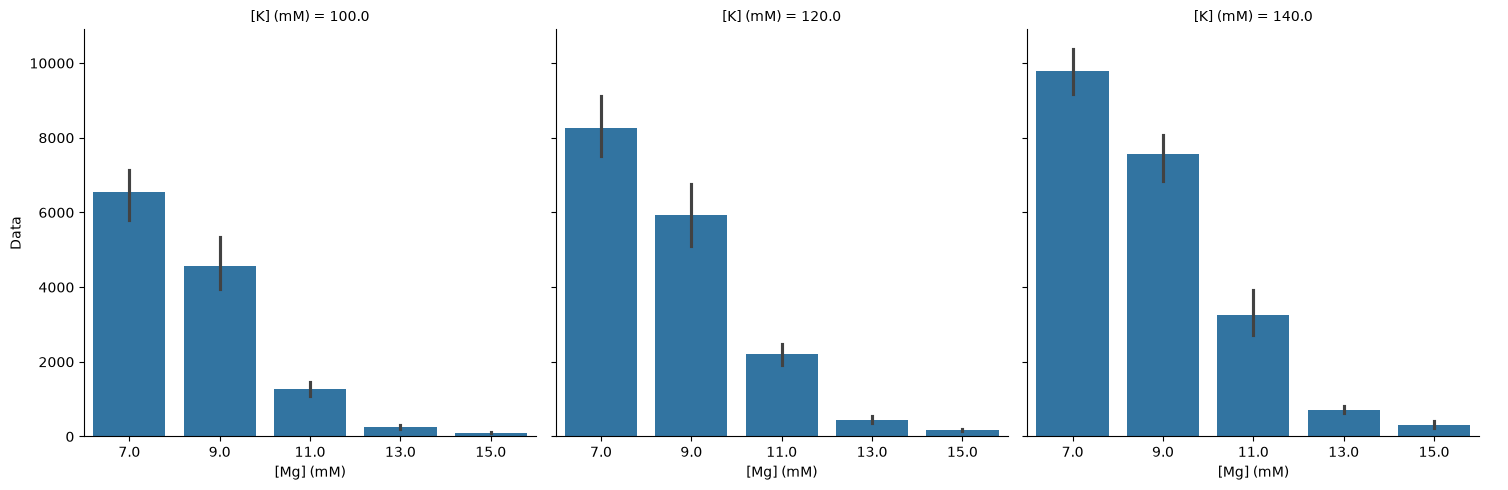
ss.head()Loading...
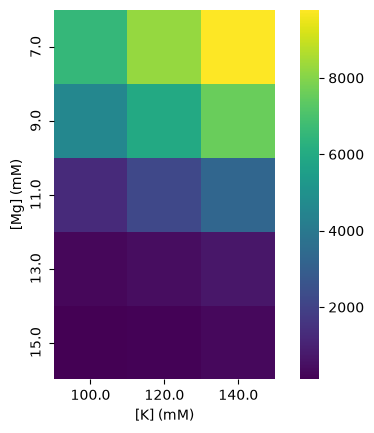
sns.heatmap(
    data=ss.groupby(["[Mg] (mM)", "[K] (mM)"])["Data"].mean().reset_index().pivot(index="[Mg] (mM)", columns="[K] (mM)", values="Data"),
    cmap="viridis",
    square=True
)
<Axes: xlabel='[K] (mM)', ylabel='[Mg] (mM)'>